Immigrants from Asia vs Kiowa Average Family Size
COMPARE
Immigrants from Asia
Kiowa
Average Family Size
Average Family Size Comparison
Immigrants from Asia
Kiowa
3.27
AVERAGE FAMILY SIZE
94.0/ 100
METRIC RATING
118th/ 347
METRIC RANK
3.27
AVERAGE FAMILY SIZE
94.8/ 100
METRIC RATING
117th/ 347
METRIC RANK
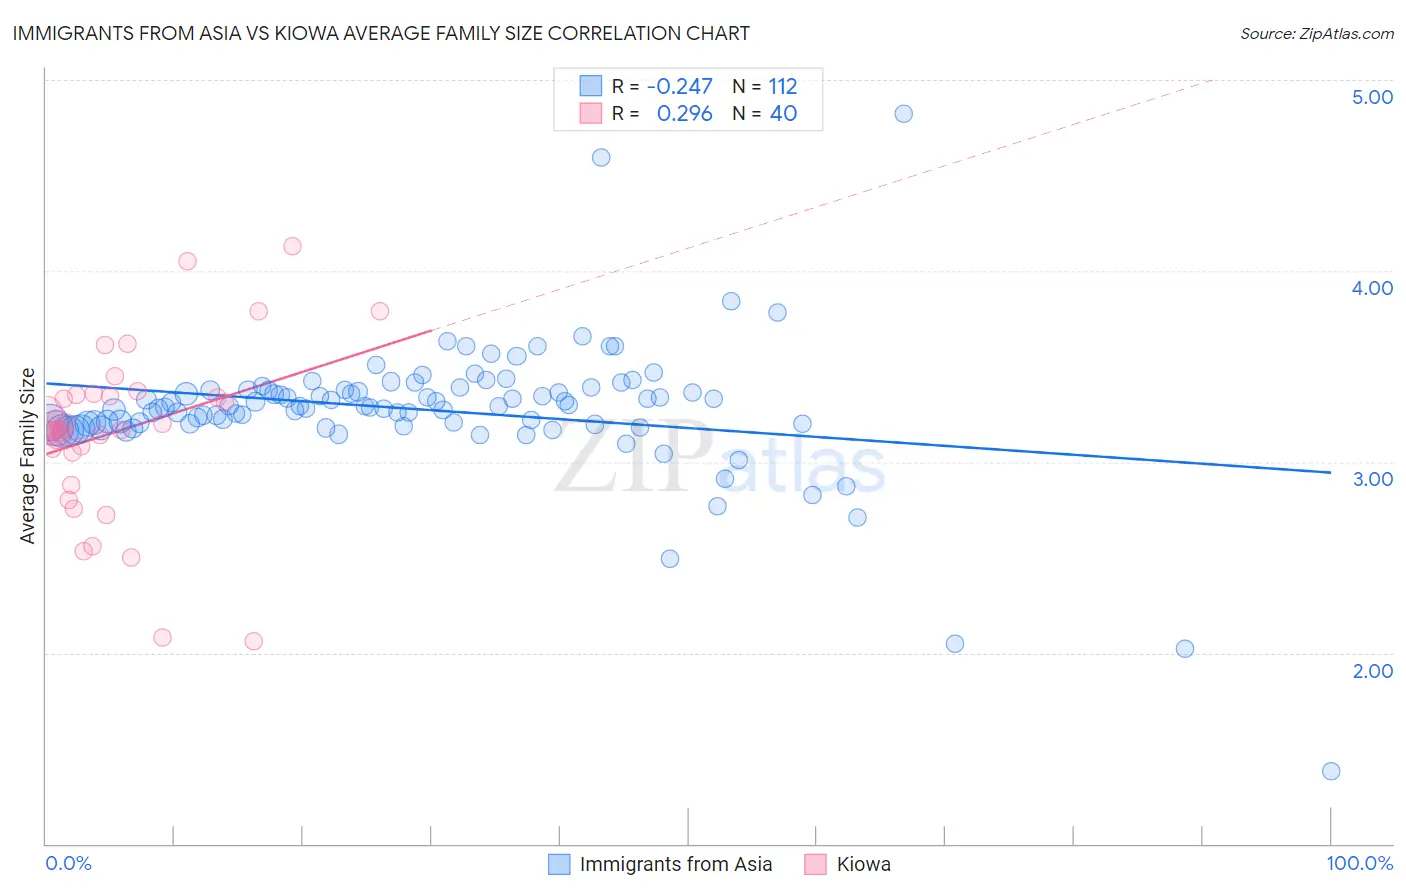
Immigrants from Asia vs Kiowa Average Family Size Correlation Chart
The statistical analysis conducted on geographies consisting of 548,543,800 people shows a weak negative correlation between the proportion of Immigrants from Asia and average family size in the United States with a correlation coefficient (R) of -0.247 and weighted average of 3.27. Similarly, the statistical analysis conducted on geographies consisting of 56,098,854 people shows a weak positive correlation between the proportion of Kiowa and average family size in the United States with a correlation coefficient (R) of 0.296 and weighted average of 3.27, a difference of 0.070%.
Average Family Size Correlation Summary
| Measurement | Immigrants from Asia | Kiowa |
| Minimum | 1.38 | 2.06 |
| Maximum | 4.82 | 4.13 |
| Range | 3.44 | 2.07 |
| Mean | 3.27 | 3.16 |
| Median | 3.29 | 3.17 |
| Interquartile 25% (IQ1) | 3.20 | 3.06 |
| Interquartile 75% (IQ3) | 3.38 | 3.35 |
| Interquartile Range (IQR) | 0.18 | 0.29 |
| Standard Deviation (Sample) | 0.37 | 0.44 |
| Standard Deviation (Population) | 0.36 | 0.43 |
Demographics Similar to Immigrants from Asia and Kiowa by Average Family Size
In terms of average family size, the demographic groups most similar to Immigrants from Asia are Immigrants from Indonesia (3.27, a difference of 0.020%), Immigrants from Bahamas (3.27, a difference of 0.030%), Immigrants from Thailand (3.27, a difference of 0.050%), Immigrants from Liberia (3.27, a difference of 0.090%), and Immigrants from South America (3.27, a difference of 0.090%). Similarly, the demographic groups most similar to Kiowa are Immigrants from Liberia (3.27, a difference of 0.020%), Immigrants from South America (3.27, a difference of 0.020%), South American (3.27, a difference of 0.030%), Immigrants from Panama (3.27, a difference of 0.080%), and Black/African American (3.27, a difference of 0.090%).
| Demographics | Rating | Rank | Average Family Size |
| Ghanaians | 98.0 /100 | #107 | Exceptional 3.29 |
| Asians | 97.0 /100 | #108 | Exceptional 3.28 |
| Puerto Ricans | 96.7 /100 | #109 | Exceptional 3.28 |
| Bahamians | 96.6 /100 | #110 | Exceptional 3.28 |
| Indonesians | 96.2 /100 | #111 | Exceptional 3.28 |
| Blacks/African Americans | 95.7 /100 | #112 | Exceptional 3.27 |
| Immigrants | Panama | 95.6 /100 | #113 | Exceptional 3.27 |
| South Americans | 95.1 /100 | #114 | Exceptional 3.27 |
| Immigrants | Liberia | 95.0 /100 | #115 | Exceptional 3.27 |
| Immigrants | South America | 95.0 /100 | #116 | Exceptional 3.27 |
| Kiowa | 94.8 /100 | #117 | Exceptional 3.27 |
| Immigrants | Asia | 94.0 /100 | #118 | Exceptional 3.27 |
| Immigrants | Indonesia | 93.7 /100 | #119 | Exceptional 3.27 |
| Immigrants | Bahamas | 93.6 /100 | #120 | Exceptional 3.27 |
| Immigrants | Thailand | 93.3 /100 | #121 | Exceptional 3.27 |
| Immigrants | Colombia | 92.8 /100 | #122 | Exceptional 3.27 |
| Alaskan Athabascans | 92.4 /100 | #123 | Exceptional 3.27 |
| South American Indians | 91.6 /100 | #124 | Exceptional 3.26 |
| Immigrants | Cuba | 91.3 /100 | #125 | Exceptional 3.26 |
| Immigrants | Costa Rica | 90.7 /100 | #126 | Exceptional 3.26 |
| Immigrants | Syria | 90.6 /100 | #127 | Exceptional 3.26 |