Fijian vs Immigrants from Cabo Verde Male Disability
COMPARE
Fijian
Immigrants from Cabo Verde
Male Disability
Male Disability Comparison
Fijians
Immigrants from Cabo Verde
12.6%
MALE DISABILITY
0.0/ 100
METRIC RATING
275th/ 347
METRIC RANK
12.8%
MALE DISABILITY
0.0/ 100
METRIC RATING
289th/ 347
METRIC RANK
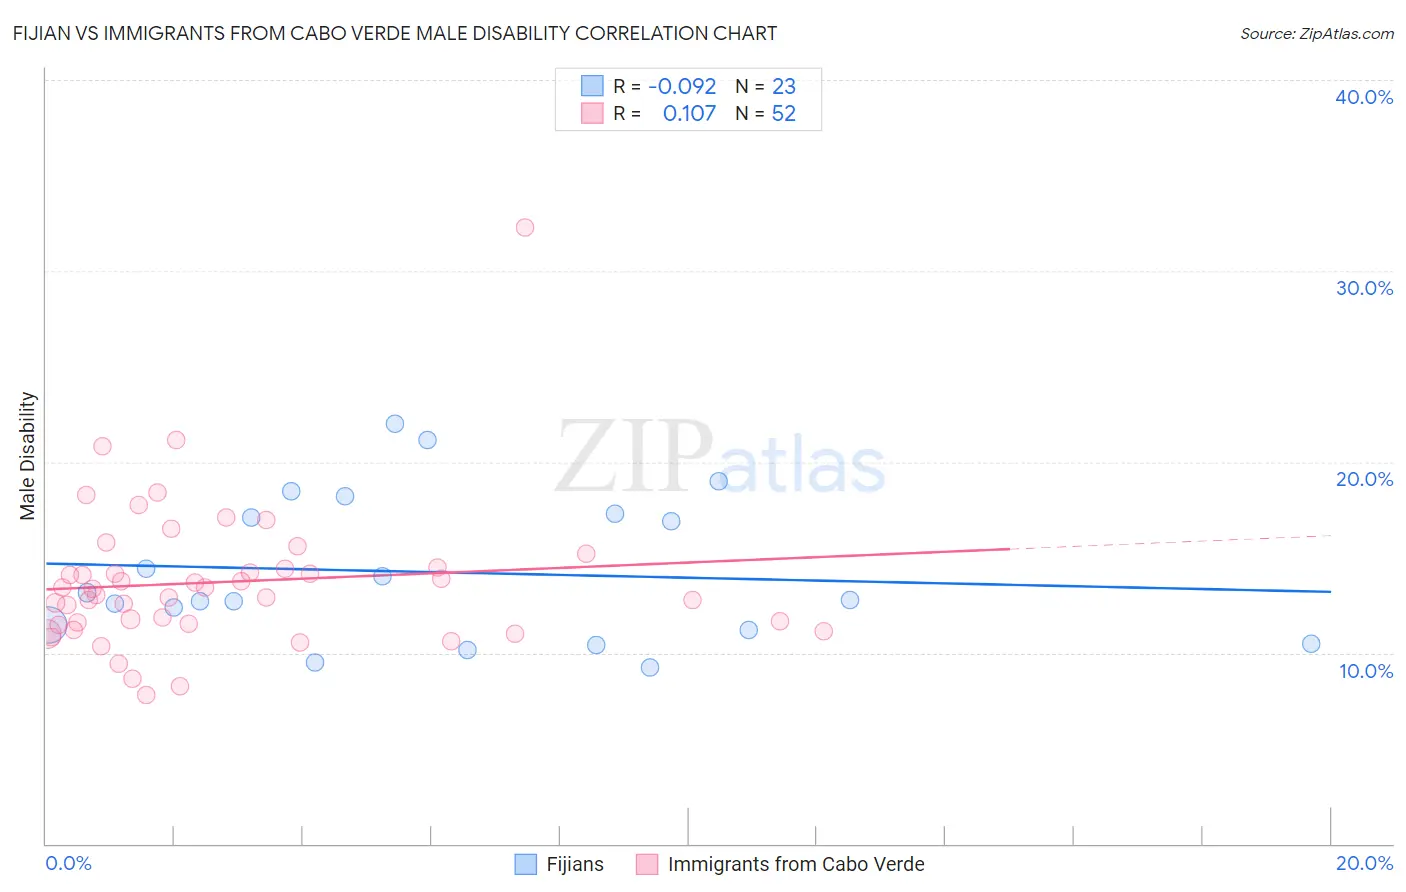
Fijian vs Immigrants from Cabo Verde Male Disability Correlation Chart
The statistical analysis conducted on geographies consisting of 55,947,896 people shows a slight negative correlation between the proportion of Fijians and percentage of males with a disability in the United States with a correlation coefficient (R) of -0.092 and weighted average of 12.6%. Similarly, the statistical analysis conducted on geographies consisting of 38,149,674 people shows a poor positive correlation between the proportion of Immigrants from Cabo Verde and percentage of males with a disability in the United States with a correlation coefficient (R) of 0.107 and weighted average of 12.8%, a difference of 2.0%.
Male Disability Correlation Summary
| Measurement | Fijian | Immigrants from Cabo Verde |
| Minimum | 9.2% | 7.8% |
| Maximum | 22.0% | 32.3% |
| Range | 12.7% | 24.5% |
| Mean | 14.2% | 13.7% |
| Median | 12.8% | 13.2% |
| Interquartile 25% (IQ1) | 11.2% | 11.5% |
| Interquartile 75% (IQ3) | 17.3% | 14.4% |
| Interquartile Range (IQR) | 6.0% | 3.0% |
| Standard Deviation (Sample) | 3.8% | 3.9% |
| Standard Deviation (Population) | 3.7% | 3.8% |
Demographics Similar to Fijians and Immigrants from Cabo Verde by Male Disability
In terms of male disability, the demographic groups most similar to Fijians are African (12.6%, a difference of 0.050%), Hopi (12.5%, a difference of 0.35%), Finnish (12.6%, a difference of 0.37%), Native Hawaiian (12.5%, a difference of 0.68%), and Hmong (12.5%, a difference of 0.75%). Similarly, the demographic groups most similar to Immigrants from Cabo Verde are Pima (12.8%, a difference of 0.15%), Yup'ik (12.8%, a difference of 0.19%), White/Caucasian (12.8%, a difference of 0.24%), English (12.8%, a difference of 0.30%), and Cape Verdean (12.8%, a difference of 0.38%).
| Demographics | Rating | Rank | Male Disability |
| Hmong | 0.0 /100 | #272 | Tragic 12.5% |
| Native Hawaiians | 0.0 /100 | #273 | Tragic 12.5% |
| Hopi | 0.0 /100 | #274 | Tragic 12.5% |
| Fijians | 0.0 /100 | #275 | Tragic 12.6% |
| Africans | 0.0 /100 | #276 | Tragic 12.6% |
| Finns | 0.0 /100 | #277 | Tragic 12.6% |
| Central American Indians | 0.0 /100 | #278 | Tragic 12.7% |
| Slovaks | 0.0 /100 | #279 | Tragic 12.7% |
| Dutch | 0.0 /100 | #280 | Tragic 12.7% |
| Sioux | 0.0 /100 | #281 | Tragic 12.7% |
| Irish | 0.0 /100 | #282 | Tragic 12.7% |
| Germans | 0.0 /100 | #283 | Tragic 12.7% |
| Spanish | 0.0 /100 | #284 | Tragic 12.7% |
| Welsh | 0.0 /100 | #285 | Tragic 12.7% |
| Scottish | 0.0 /100 | #286 | Tragic 12.8% |
| Cape Verdeans | 0.0 /100 | #287 | Tragic 12.8% |
| Yup'ik | 0.0 /100 | #288 | Tragic 12.8% |
| Immigrants | Cabo Verde | 0.0 /100 | #289 | Tragic 12.8% |
| Pima | 0.0 /100 | #290 | Tragic 12.8% |
| Whites/Caucasians | 0.0 /100 | #291 | Tragic 12.8% |
| English | 0.0 /100 | #292 | Tragic 12.8% |