Ugandan vs Albanian Average Family Size
COMPARE
Ugandan
Albanian
Average Family Size
Average Family Size Comparison
Ugandans
Albanians
3.23
AVERAGE FAMILY SIZE
58.4/ 100
METRIC RATING
165th/ 347
METRIC RANK
3.17
AVERAGE FAMILY SIZE
1.5/ 100
METRIC RATING
257th/ 347
METRIC RANK
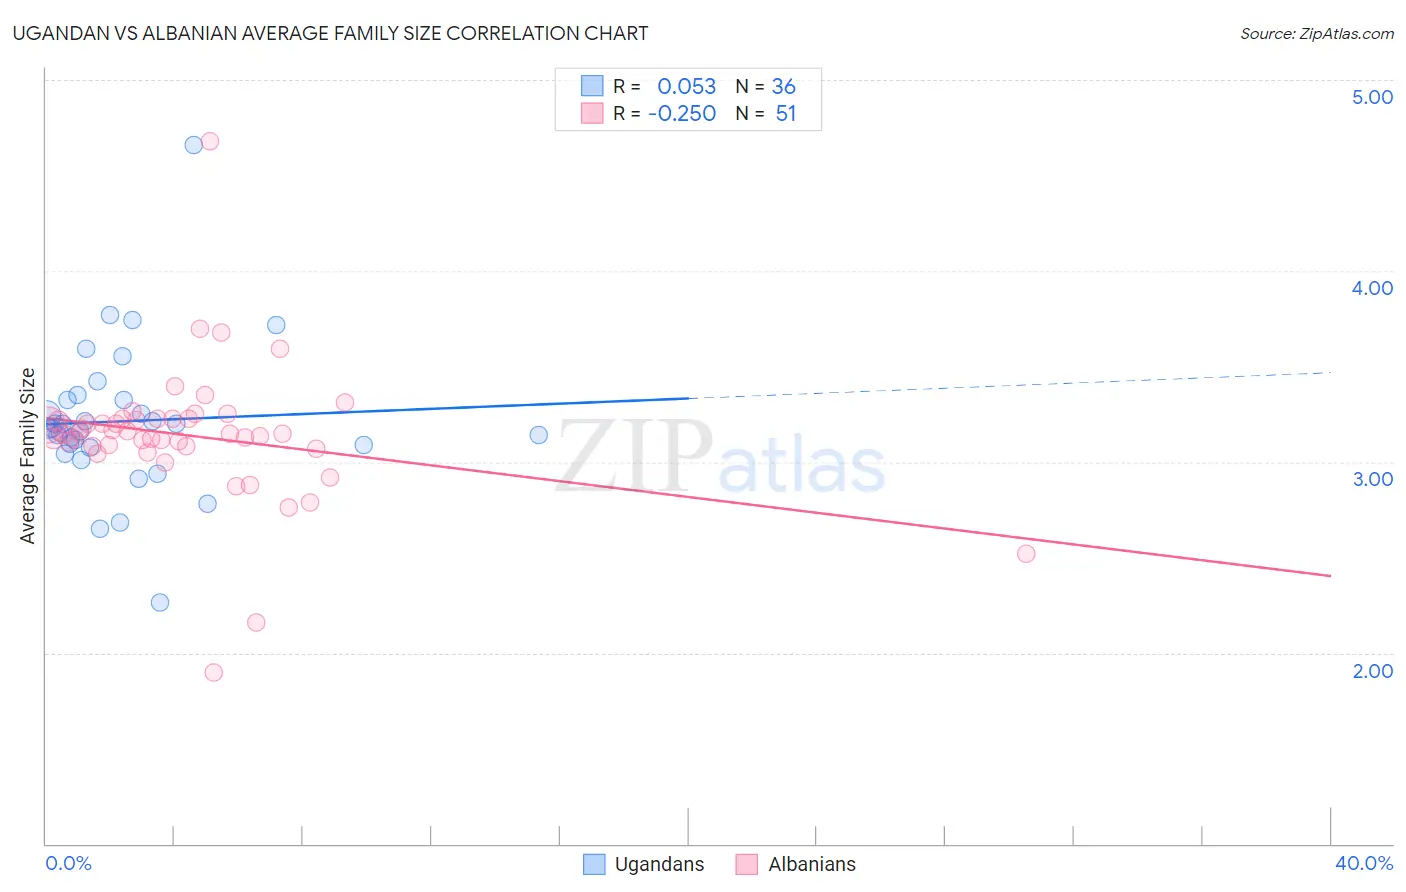
Ugandan vs Albanian Average Family Size Correlation Chart
The statistical analysis conducted on geographies consisting of 93,998,632 people shows a slight positive correlation between the proportion of Ugandans and average family size in the United States with a correlation coefficient (R) of 0.053 and weighted average of 3.23. Similarly, the statistical analysis conducted on geographies consisting of 193,186,402 people shows a weak negative correlation between the proportion of Albanians and average family size in the United States with a correlation coefficient (R) of -0.250 and weighted average of 3.17, a difference of 2.1%.
Average Family Size Correlation Summary
| Measurement | Ugandan | Albanian |
| Minimum | 2.26 | 1.90 |
| Maximum | 4.66 | 4.68 |
| Range | 2.40 | 2.78 |
| Mean | 3.21 | 3.14 |
| Median | 3.17 | 3.15 |
| Interquartile 25% (IQ1) | 3.08 | 3.08 |
| Interquartile 75% (IQ3) | 3.33 | 3.22 |
| Interquartile Range (IQR) | 0.25 | 0.15 |
| Standard Deviation (Sample) | 0.39 | 0.37 |
| Standard Deviation (Population) | 0.38 | 0.37 |
Similar Demographics by Average Family Size
Demographics Similar to Ugandans by Average Family Size
In terms of average family size, the demographic groups most similar to Ugandans are Egyptian (3.23, a difference of 0.0%), Uruguayan (3.23, a difference of 0.010%), Immigrants from Senegal (3.23, a difference of 0.020%), Immigrants from Uganda (3.23, a difference of 0.030%), and Dutch West Indian (3.23, a difference of 0.030%).
| Demographics | Rating | Rank | Average Family Size |
| Iraqis | 64.3 /100 | #158 | Good 3.24 |
| Ethiopians | 63.9 /100 | #159 | Good 3.24 |
| Immigrants | Iraq | 63.7 /100 | #160 | Good 3.24 |
| Immigrants | Chile | 63.2 /100 | #161 | Good 3.24 |
| Immigrants | Uganda | 60.1 /100 | #162 | Good 3.23 |
| Uruguayans | 58.8 /100 | #163 | Average 3.23 |
| Egyptians | 58.6 /100 | #164 | Average 3.23 |
| Ugandans | 58.4 /100 | #165 | Average 3.23 |
| Immigrants | Senegal | 57.5 /100 | #166 | Average 3.23 |
| Dutch West Indians | 56.9 /100 | #167 | Average 3.23 |
| Taiwanese | 54.2 /100 | #168 | Average 3.23 |
| Aleuts | 54.1 /100 | #169 | Average 3.23 |
| Arabs | 53.8 /100 | #170 | Average 3.23 |
| Chileans | 53.2 /100 | #171 | Average 3.23 |
| Immigrants | Congo | 52.7 /100 | #172 | Average 3.23 |
Demographics Similar to Albanians by Average Family Size
In terms of average family size, the demographic groups most similar to Albanians are Immigrants from Kazakhstan (3.17, a difference of 0.020%), Cape Verdean (3.17, a difference of 0.050%), Turkish (3.16, a difference of 0.050%), Potawatomi (3.16, a difference of 0.050%), and Immigrants from Hungary (3.17, a difference of 0.060%).
| Demographics | Rating | Rank | Average Family Size |
| Puget Sound Salish | 1.9 /100 | #250 | Tragic 3.17 |
| Immigrants | Spain | 1.8 /100 | #251 | Tragic 3.17 |
| Immigrants | Saudi Arabia | 1.7 /100 | #252 | Tragic 3.17 |
| South Africans | 1.7 /100 | #253 | Tragic 3.17 |
| Immigrants | Hungary | 1.7 /100 | #254 | Tragic 3.17 |
| Cape Verdeans | 1.6 /100 | #255 | Tragic 3.17 |
| Immigrants | Kazakhstan | 1.5 /100 | #256 | Tragic 3.17 |
| Albanians | 1.5 /100 | #257 | Tragic 3.17 |
| Turks | 1.3 /100 | #258 | Tragic 3.16 |
| Potawatomi | 1.3 /100 | #259 | Tragic 3.16 |
| Immigrants | Albania | 1.3 /100 | #260 | Tragic 3.16 |
| Immigrants | North Macedonia | 1.3 /100 | #261 | Tragic 3.16 |
| Immigrants | Russia | 1.3 /100 | #262 | Tragic 3.16 |
| Immigrants | Bulgaria | 1.0 /100 | #263 | Tragic 3.16 |
| Americans | 1.0 /100 | #264 | Tragic 3.16 |