Yakama vs Albanian Average Family Size
COMPARE
Yakama
Albanian
Average Family Size
Average Family Size Comparison
Yakama
Albanians
3.45
AVERAGE FAMILY SIZE
100.0/ 100
METRIC RATING
25th/ 347
METRIC RANK
3.17
AVERAGE FAMILY SIZE
1.5/ 100
METRIC RATING
257th/ 347
METRIC RANK
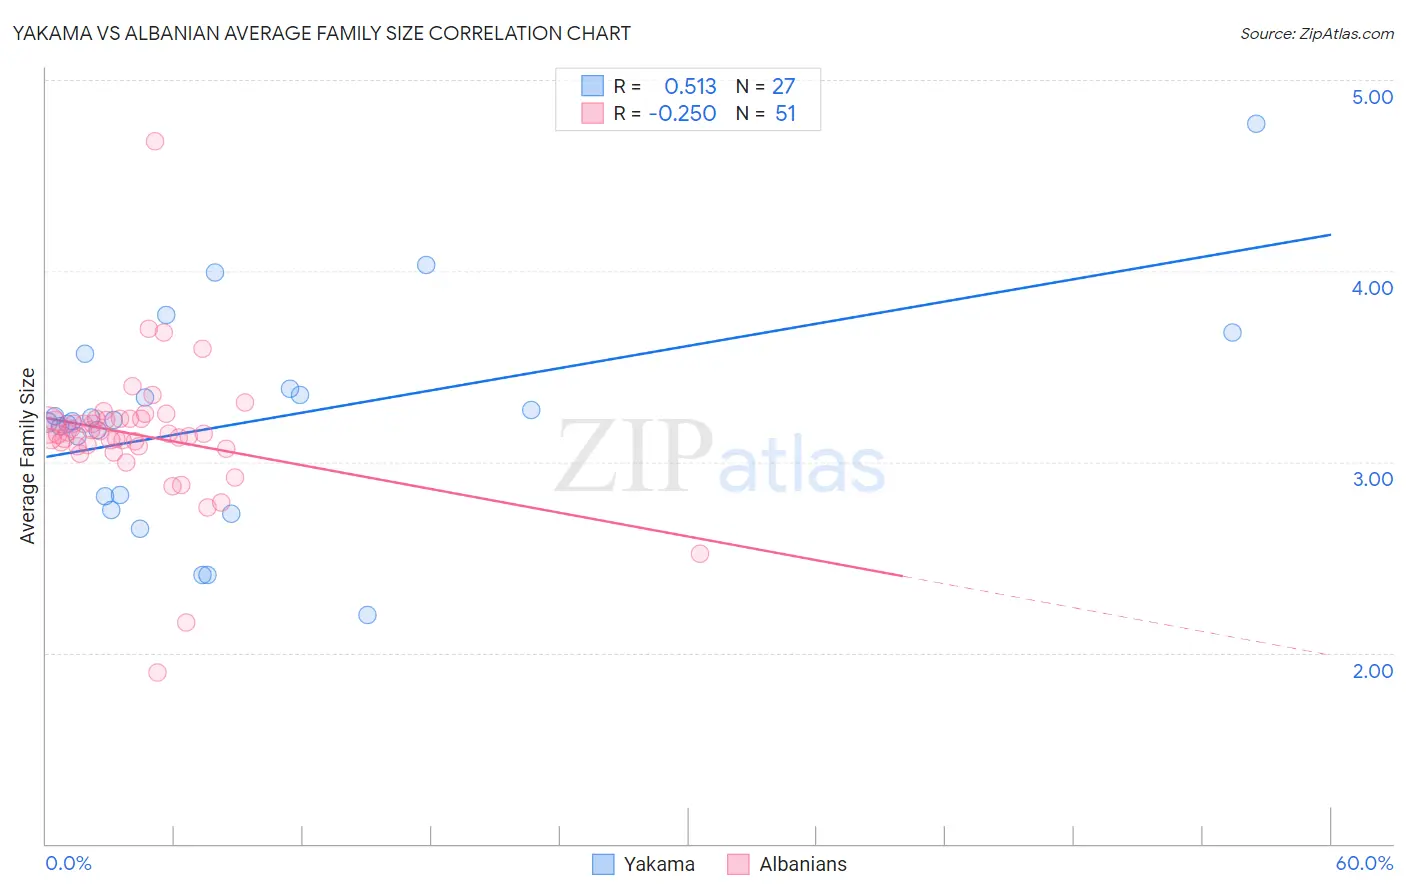
Yakama vs Albanian Average Family Size Correlation Chart
The statistical analysis conducted on geographies consisting of 19,917,879 people shows a substantial positive correlation between the proportion of Yakama and average family size in the United States with a correlation coefficient (R) of 0.513 and weighted average of 3.45. Similarly, the statistical analysis conducted on geographies consisting of 193,186,402 people shows a weak negative correlation between the proportion of Albanians and average family size in the United States with a correlation coefficient (R) of -0.250 and weighted average of 3.17, a difference of 8.8%.
Average Family Size Correlation Summary
| Measurement | Yakama | Albanian |
| Minimum | 2.20 | 1.90 |
| Maximum | 4.77 | 4.68 |
| Range | 2.57 | 2.78 |
| Mean | 3.21 | 3.14 |
| Median | 3.21 | 3.15 |
| Interquartile 25% (IQ1) | 2.82 | 3.08 |
| Interquartile 75% (IQ3) | 3.38 | 3.22 |
| Interquartile Range (IQR) | 0.56 | 0.15 |
| Standard Deviation (Sample) | 0.55 | 0.37 |
| Standard Deviation (Population) | 0.54 | 0.37 |
Similar Demographics by Average Family Size
Demographics Similar to Yakama by Average Family Size
In terms of average family size, the demographic groups most similar to Yakama are Native/Alaskan (3.45, a difference of 0.11%), Immigrants from Fiji (3.45, a difference of 0.23%), Native Hawaiian (3.43, a difference of 0.51%), Apache (3.46, a difference of 0.52%), and Mexican American Indian (3.43, a difference of 0.52%).
| Demographics | Rating | Rank | Average Family Size |
| Salvadorans | 100.0 /100 | #18 | Exceptional 3.48 |
| Mexicans | 100.0 /100 | #19 | Exceptional 3.48 |
| Cheyenne | 100.0 /100 | #20 | Exceptional 3.47 |
| Yuman | 100.0 /100 | #21 | Exceptional 3.47 |
| Apache | 100.0 /100 | #22 | Exceptional 3.46 |
| Immigrants | Fiji | 100.0 /100 | #23 | Exceptional 3.45 |
| Natives/Alaskans | 100.0 /100 | #24 | Exceptional 3.45 |
| Yakama | 100.0 /100 | #25 | Exceptional 3.45 |
| Native Hawaiians | 100.0 /100 | #26 | Exceptional 3.43 |
| Mexican American Indians | 100.0 /100 | #27 | Exceptional 3.43 |
| Immigrants | Latin America | 100.0 /100 | #28 | Exceptional 3.42 |
| Nepalese | 100.0 /100 | #29 | Exceptional 3.42 |
| Samoans | 100.0 /100 | #30 | Exceptional 3.42 |
| Central Americans | 100.0 /100 | #31 | Exceptional 3.41 |
| Immigrants | Guatemala | 100.0 /100 | #32 | Exceptional 3.41 |
Demographics Similar to Albanians by Average Family Size
In terms of average family size, the demographic groups most similar to Albanians are Immigrants from Kazakhstan (3.17, a difference of 0.020%), Cape Verdean (3.17, a difference of 0.050%), Turkish (3.16, a difference of 0.050%), Potawatomi (3.16, a difference of 0.050%), and Immigrants from Hungary (3.17, a difference of 0.060%).
| Demographics | Rating | Rank | Average Family Size |
| Puget Sound Salish | 1.9 /100 | #250 | Tragic 3.17 |
| Immigrants | Spain | 1.8 /100 | #251 | Tragic 3.17 |
| Immigrants | Saudi Arabia | 1.7 /100 | #252 | Tragic 3.17 |
| South Africans | 1.7 /100 | #253 | Tragic 3.17 |
| Immigrants | Hungary | 1.7 /100 | #254 | Tragic 3.17 |
| Cape Verdeans | 1.6 /100 | #255 | Tragic 3.17 |
| Immigrants | Kazakhstan | 1.5 /100 | #256 | Tragic 3.17 |
| Albanians | 1.5 /100 | #257 | Tragic 3.17 |
| Turks | 1.3 /100 | #258 | Tragic 3.16 |
| Potawatomi | 1.3 /100 | #259 | Tragic 3.16 |
| Immigrants | Albania | 1.3 /100 | #260 | Tragic 3.16 |
| Immigrants | North Macedonia | 1.3 /100 | #261 | Tragic 3.16 |
| Immigrants | Russia | 1.3 /100 | #262 | Tragic 3.16 |
| Immigrants | Bulgaria | 1.0 /100 | #263 | Tragic 3.16 |
| Americans | 1.0 /100 | #264 | Tragic 3.16 |