Indonesian vs Albanian Average Family Size
COMPARE
Indonesian
Albanian
Average Family Size
Average Family Size Comparison
Indonesians
Albanians
3.28
AVERAGE FAMILY SIZE
96.2/ 100
METRIC RATING
111th/ 347
METRIC RANK
3.17
AVERAGE FAMILY SIZE
1.5/ 100
METRIC RATING
257th/ 347
METRIC RANK
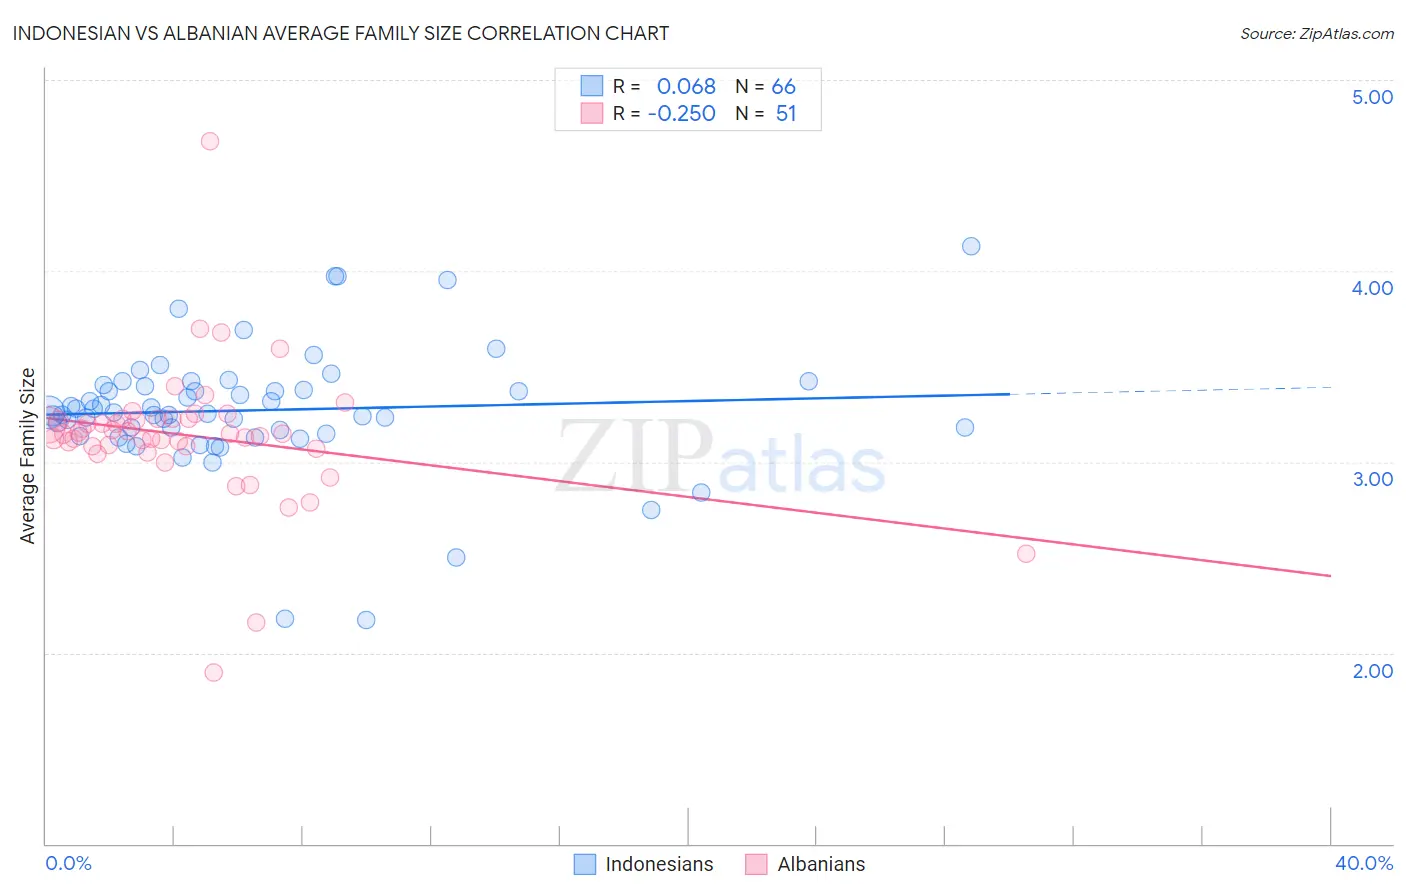
Indonesian vs Albanian Average Family Size Correlation Chart
The statistical analysis conducted on geographies consisting of 162,608,656 people shows a slight positive correlation between the proportion of Indonesians and average family size in the United States with a correlation coefficient (R) of 0.068 and weighted average of 3.28. Similarly, the statistical analysis conducted on geographies consisting of 193,186,402 people shows a weak negative correlation between the proportion of Albanians and average family size in the United States with a correlation coefficient (R) of -0.250 and weighted average of 3.17, a difference of 3.5%.
Average Family Size Correlation Summary
| Measurement | Indonesian | Albanian |
| Minimum | 2.17 | 1.90 |
| Maximum | 4.13 | 4.68 |
| Range | 1.96 | 2.78 |
| Mean | 3.27 | 3.14 |
| Median | 3.25 | 3.15 |
| Interquartile 25% (IQ1) | 3.15 | 3.08 |
| Interquartile 75% (IQ3) | 3.40 | 3.22 |
| Interquartile Range (IQR) | 0.25 | 0.15 |
| Standard Deviation (Sample) | 0.33 | 0.37 |
| Standard Deviation (Population) | 0.33 | 0.37 |
Similar Demographics by Average Family Size
Demographics Similar to Indonesians by Average Family Size
In terms of average family size, the demographic groups most similar to Indonesians are Bahamian (3.28, a difference of 0.050%), Puerto Rican (3.28, a difference of 0.060%), Black/African American (3.27, a difference of 0.060%), Immigrants from Panama (3.27, a difference of 0.070%), and Asian (3.28, a difference of 0.11%).
| Demographics | Rating | Rank | Average Family Size |
| Bolivians | 98.3 /100 | #104 | Exceptional 3.29 |
| Immigrants | Ghana | 98.1 /100 | #105 | Exceptional 3.29 |
| Paiute | 98.0 /100 | #106 | Exceptional 3.29 |
| Ghanaians | 98.0 /100 | #107 | Exceptional 3.29 |
| Asians | 97.0 /100 | #108 | Exceptional 3.28 |
| Puerto Ricans | 96.7 /100 | #109 | Exceptional 3.28 |
| Bahamians | 96.6 /100 | #110 | Exceptional 3.28 |
| Indonesians | 96.2 /100 | #111 | Exceptional 3.28 |
| Blacks/African Americans | 95.7 /100 | #112 | Exceptional 3.27 |
| Immigrants | Panama | 95.6 /100 | #113 | Exceptional 3.27 |
| South Americans | 95.1 /100 | #114 | Exceptional 3.27 |
| Immigrants | Liberia | 95.0 /100 | #115 | Exceptional 3.27 |
| Immigrants | South America | 95.0 /100 | #116 | Exceptional 3.27 |
| Kiowa | 94.8 /100 | #117 | Exceptional 3.27 |
| Immigrants | Asia | 94.0 /100 | #118 | Exceptional 3.27 |
Demographics Similar to Albanians by Average Family Size
In terms of average family size, the demographic groups most similar to Albanians are Immigrants from Kazakhstan (3.17, a difference of 0.020%), Cape Verdean (3.17, a difference of 0.050%), Turkish (3.16, a difference of 0.050%), Potawatomi (3.16, a difference of 0.050%), and Immigrants from Hungary (3.17, a difference of 0.060%).
| Demographics | Rating | Rank | Average Family Size |
| Puget Sound Salish | 1.9 /100 | #250 | Tragic 3.17 |
| Immigrants | Spain | 1.8 /100 | #251 | Tragic 3.17 |
| Immigrants | Saudi Arabia | 1.7 /100 | #252 | Tragic 3.17 |
| South Africans | 1.7 /100 | #253 | Tragic 3.17 |
| Immigrants | Hungary | 1.7 /100 | #254 | Tragic 3.17 |
| Cape Verdeans | 1.6 /100 | #255 | Tragic 3.17 |
| Immigrants | Kazakhstan | 1.5 /100 | #256 | Tragic 3.17 |
| Albanians | 1.5 /100 | #257 | Tragic 3.17 |
| Turks | 1.3 /100 | #258 | Tragic 3.16 |
| Potawatomi | 1.3 /100 | #259 | Tragic 3.16 |
| Immigrants | Albania | 1.3 /100 | #260 | Tragic 3.16 |
| Immigrants | North Macedonia | 1.3 /100 | #261 | Tragic 3.16 |
| Immigrants | Russia | 1.3 /100 | #262 | Tragic 3.16 |
| Immigrants | Bulgaria | 1.0 /100 | #263 | Tragic 3.16 |
| Americans | 1.0 /100 | #264 | Tragic 3.16 |