Ethiopian vs Polish Divorced or Separated
COMPARE
Ethiopian
Polish
Divorced or Separated
Divorced or Separated Comparison
Ethiopians
Poles
12.0%
DIVORCED OR SEPARATED
58.5/ 100
METRIC RATING
167th/ 347
METRIC RANK
11.9%
DIVORCED OR SEPARATED
78.6/ 100
METRIC RATING
147th/ 347
METRIC RANK
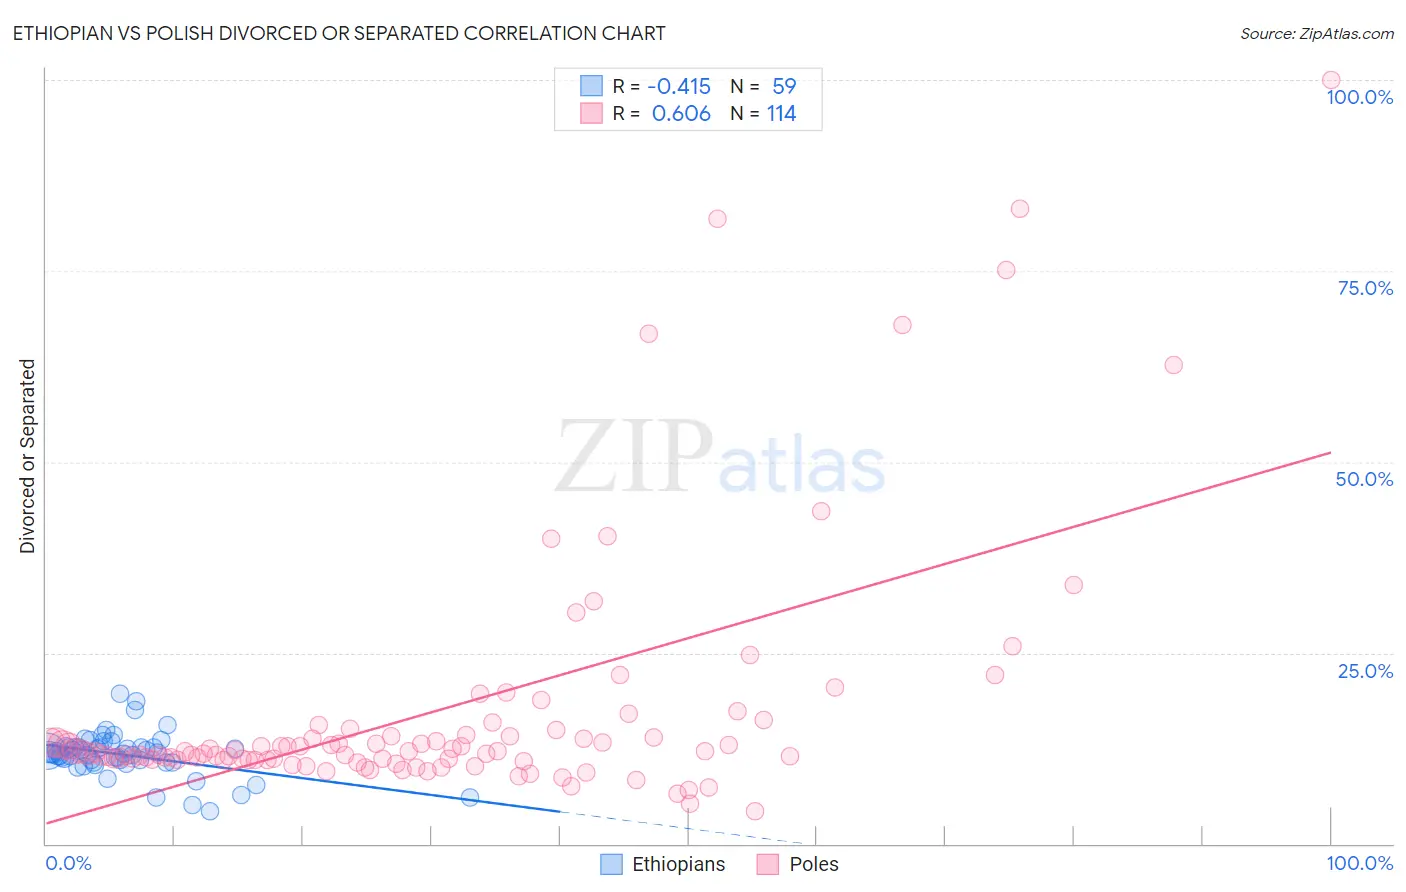
Ethiopian vs Polish Divorced or Separated Correlation Chart
The statistical analysis conducted on geographies consisting of 223,166,328 people shows a moderate negative correlation between the proportion of Ethiopians and percentage of population currently divorced or separated in the United States with a correlation coefficient (R) of -0.415 and weighted average of 12.0%. Similarly, the statistical analysis conducted on geographies consisting of 560,123,117 people shows a significant positive correlation between the proportion of Poles and percentage of population currently divorced or separated in the United States with a correlation coefficient (R) of 0.606 and weighted average of 11.9%, a difference of 0.84%.
Divorced or Separated Correlation Summary
| Measurement | Ethiopian | Polish |
| Minimum | 4.3% | 4.3% |
| Maximum | 19.7% | 100.0% |
| Range | 15.4% | 95.7% |
| Mean | 11.7% | 17.6% |
| Median | 11.8% | 12.1% |
| Interquartile 25% (IQ1) | 10.7% | 11.0% |
| Interquartile 75% (IQ3) | 12.6% | 14.3% |
| Interquartile Range (IQR) | 1.9% | 3.2% |
| Standard Deviation (Sample) | 2.8% | 16.8% |
| Standard Deviation (Population) | 2.8% | 16.7% |
Demographics Similar to Ethiopians and Poles by Divorced or Separated
In terms of divorced or separated, the demographic groups most similar to Ethiopians are Tohono O'odham (12.0%, a difference of 0.070%), German Russian (12.0%, a difference of 0.12%), Swiss (12.0%, a difference of 0.19%), Navajo (12.0%, a difference of 0.20%), and Samoan (12.0%, a difference of 0.21%). Similarly, the demographic groups most similar to Poles are Italian (11.9%, a difference of 0.040%), Immigrants from Oceania (11.9%, a difference of 0.050%), Immigrants from Portugal (11.9%, a difference of 0.070%), Czech (11.9%, a difference of 0.11%), and Immigrants from Hungary (11.9%, a difference of 0.24%).
| Demographics | Rating | Rank | Divorced or Separated |
| Poles | 78.6 /100 | #147 | Good 11.9% |
| Italians | 77.8 /100 | #148 | Good 11.9% |
| Immigrants | Oceania | 77.7 /100 | #149 | Good 11.9% |
| Immigrants | Portugal | 77.3 /100 | #150 | Good 11.9% |
| Czechs | 76.4 /100 | #151 | Good 11.9% |
| Immigrants | Hungary | 73.7 /100 | #152 | Good 11.9% |
| Austrians | 72.2 /100 | #153 | Good 12.0% |
| Chileans | 71.3 /100 | #154 | Good 12.0% |
| Japanese | 70.9 /100 | #155 | Good 12.0% |
| Hungarians | 70.3 /100 | #156 | Good 12.0% |
| Immigrants | Brazil | 68.8 /100 | #157 | Good 12.0% |
| Icelanders | 66.0 /100 | #158 | Good 12.0% |
| Immigrants | Barbados | 66.0 /100 | #159 | Good 12.0% |
| Immigrants | Scotland | 65.8 /100 | #160 | Good 12.0% |
| Marshallese | 64.6 /100 | #161 | Good 12.0% |
| Samoans | 64.3 /100 | #162 | Good 12.0% |
| Navajo | 63.9 /100 | #163 | Good 12.0% |
| Swiss | 63.6 /100 | #164 | Good 12.0% |
| German Russians | 61.8 /100 | #165 | Good 12.0% |
| Tohono O'odham | 60.4 /100 | #166 | Good 12.0% |
| Ethiopians | 58.5 /100 | #167 | Average 12.0% |