Immigrants from Africa vs Polish Divorced or Separated
COMPARE
Immigrants from Africa
Polish
Divorced or Separated
Divorced or Separated Comparison
Immigrants from Africa
Poles
12.1%
DIVORCED OR SEPARATED
30.3/ 100
METRIC RATING
197th/ 347
METRIC RANK
11.9%
DIVORCED OR SEPARATED
78.6/ 100
METRIC RATING
147th/ 347
METRIC RANK
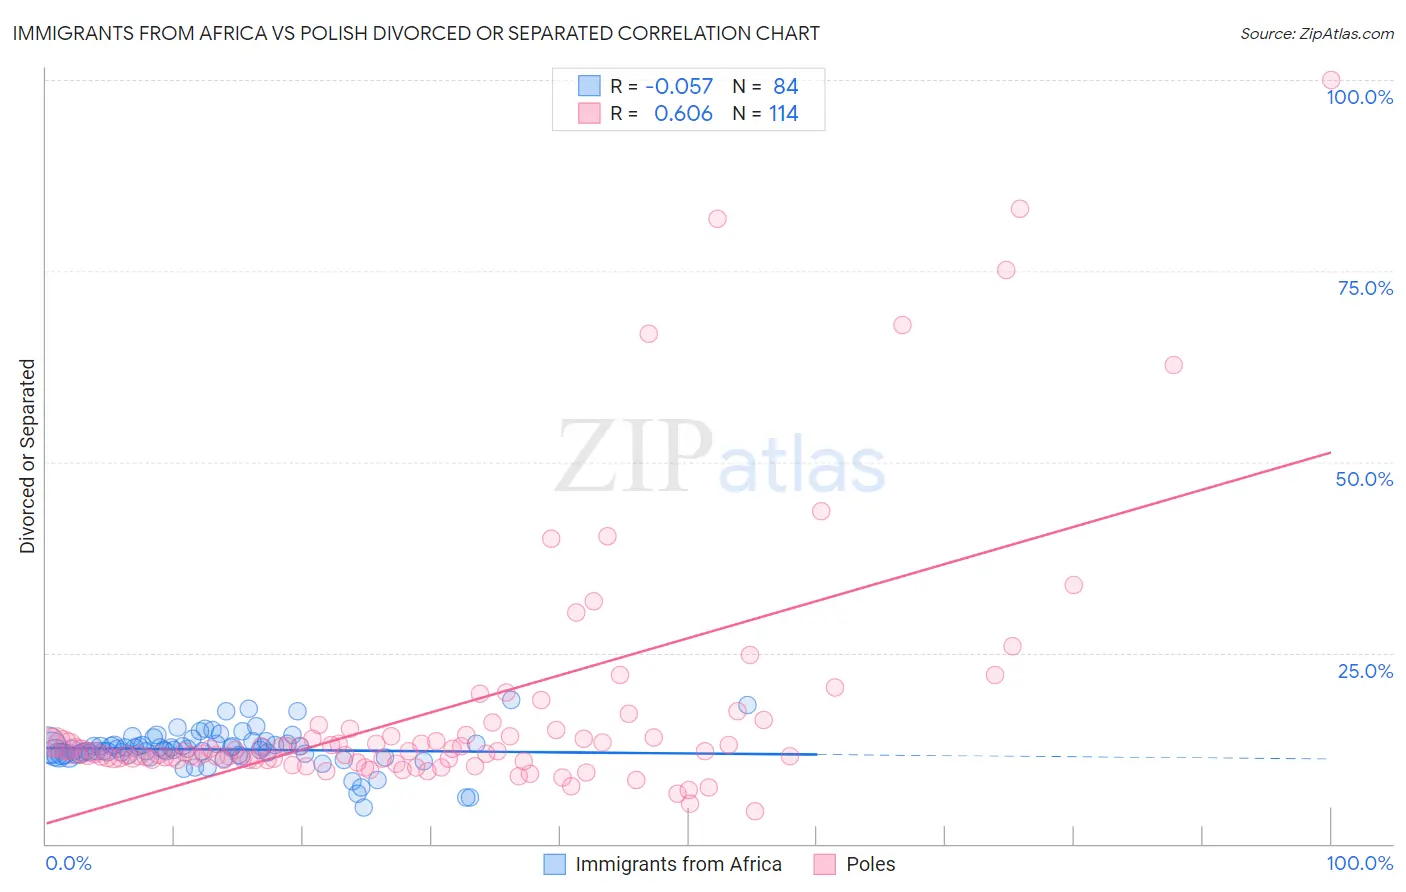
Immigrants from Africa vs Polish Divorced or Separated Correlation Chart
The statistical analysis conducted on geographies consisting of 469,119,940 people shows a slight negative correlation between the proportion of Immigrants from Africa and percentage of population currently divorced or separated in the United States with a correlation coefficient (R) of -0.057 and weighted average of 12.1%. Similarly, the statistical analysis conducted on geographies consisting of 560,123,117 people shows a significant positive correlation between the proportion of Poles and percentage of population currently divorced or separated in the United States with a correlation coefficient (R) of 0.606 and weighted average of 11.9%, a difference of 1.9%.
Divorced or Separated Correlation Summary
| Measurement | Immigrants from Africa | Polish |
| Minimum | 4.8% | 4.3% |
| Maximum | 18.8% | 100.0% |
| Range | 14.0% | 95.7% |
| Mean | 12.4% | 17.6% |
| Median | 12.3% | 12.1% |
| Interquartile 25% (IQ1) | 11.7% | 11.0% |
| Interquartile 75% (IQ3) | 13.1% | 14.3% |
| Interquartile Range (IQR) | 1.5% | 3.2% |
| Standard Deviation (Sample) | 2.4% | 16.8% |
| Standard Deviation (Population) | 2.4% | 16.7% |
Similar Demographics by Divorced or Separated
Demographics Similar to Immigrants from Africa by Divorced or Separated
In terms of divorced or separated, the demographic groups most similar to Immigrants from Africa are Immigrants from Burma/Myanmar (12.1%, a difference of 0.0%), Nigerian (12.1%, a difference of 0.010%), Immigrants from England (12.1%, a difference of 0.040%), Central American (12.1%, a difference of 0.040%), and Immigrants from Eritrea (12.1%, a difference of 0.060%).
| Demographics | Rating | Rank | Divorced or Separated |
| Moroccans | 34.8 /100 | #190 | Fair 12.1% |
| Swedes | 34.4 /100 | #191 | Fair 12.1% |
| Norwegians | 33.2 /100 | #192 | Fair 12.1% |
| Immigrants | Thailand | 32.5 /100 | #193 | Fair 12.1% |
| Immigrants | Eritrea | 31.9 /100 | #194 | Fair 12.1% |
| Immigrants | England | 31.4 /100 | #195 | Fair 12.1% |
| Immigrants | Burma/Myanmar | 30.4 /100 | #196 | Fair 12.1% |
| Immigrants | Africa | 30.3 /100 | #197 | Fair 12.1% |
| Nigerians | 30.1 /100 | #198 | Fair 12.1% |
| Central Americans | 29.4 /100 | #199 | Fair 12.1% |
| South Americans | 28.6 /100 | #200 | Fair 12.2% |
| Guatemalans | 26.9 /100 | #201 | Fair 12.2% |
| Portuguese | 23.5 /100 | #202 | Fair 12.2% |
| Immigrants | Guatemala | 23.2 /100 | #203 | Fair 12.2% |
| Kenyans | 21.8 /100 | #204 | Fair 12.2% |
Demographics Similar to Poles by Divorced or Separated
In terms of divorced or separated, the demographic groups most similar to Poles are Immigrants from Grenada (11.9%, a difference of 0.030%), Italian (11.9%, a difference of 0.040%), Immigrants from Oceania (11.9%, a difference of 0.050%), Immigrants from Portugal (11.9%, a difference of 0.070%), and Croatian (11.9%, a difference of 0.11%).
| Demographics | Rating | Rank | Divorced or Separated |
| Lebanese | 83.4 /100 | #140 | Excellent 11.9% |
| Immigrants | Morocco | 82.9 /100 | #141 | Excellent 11.9% |
| Immigrants | Zimbabwe | 81.5 /100 | #142 | Excellent 11.9% |
| Pakistanis | 81.3 /100 | #143 | Excellent 11.9% |
| Peruvians | 80.9 /100 | #144 | Excellent 11.9% |
| Croatians | 80.6 /100 | #145 | Excellent 11.9% |
| Immigrants | Grenada | 79.1 /100 | #146 | Good 11.9% |
| Poles | 78.6 /100 | #147 | Good 11.9% |
| Italians | 77.8 /100 | #148 | Good 11.9% |
| Immigrants | Oceania | 77.7 /100 | #149 | Good 11.9% |
| Immigrants | Portugal | 77.3 /100 | #150 | Good 11.9% |
| Czechs | 76.4 /100 | #151 | Good 11.9% |
| Immigrants | Hungary | 73.7 /100 | #152 | Good 11.9% |
| Austrians | 72.2 /100 | #153 | Good 12.0% |
| Chileans | 71.3 /100 | #154 | Good 12.0% |