Ethiopian vs Polish Associate's Degree
COMPARE
Ethiopian
Polish
Associate's Degree
Associate's Degree Comparison
Ethiopians
Poles
50.4%
ASSOCIATE'S DEGREE
99.1/ 100
METRIC RATING
79th/ 347
METRIC RANK
48.0%
ASSOCIATE'S DEGREE
87.3/ 100
METRIC RATING
138th/ 347
METRIC RANK
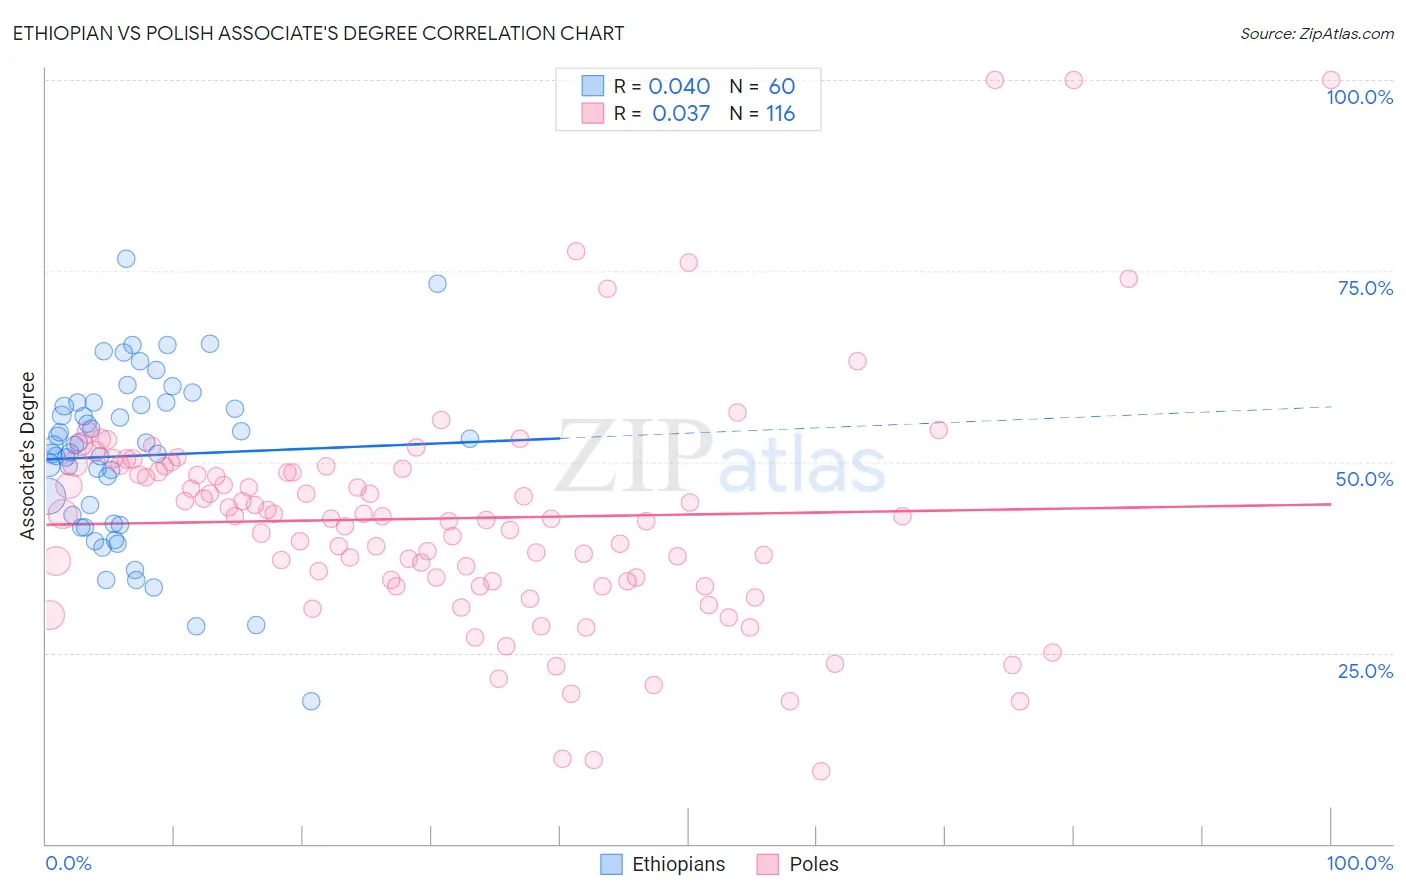
Ethiopian vs Polish Associate's Degree Correlation Chart
The statistical analysis conducted on geographies consisting of 223,259,495 people shows no correlation between the proportion of Ethiopians and percentage of population with at least associate's degree education in the United States with a correlation coefficient (R) of 0.040 and weighted average of 50.4%. Similarly, the statistical analysis conducted on geographies consisting of 560,512,147 people shows no correlation between the proportion of Poles and percentage of population with at least associate's degree education in the United States with a correlation coefficient (R) of 0.037 and weighted average of 48.0%, a difference of 5.0%.
Associate's Degree Correlation Summary
| Measurement | Ethiopian | Polish |
| Minimum | 18.6% | 9.5% |
| Maximum | 76.6% | 100.0% |
| Range | 58.0% | 90.5% |
| Mean | 50.8% | 42.6% |
| Median | 52.2% | 42.7% |
| Interquartile 25% (IQ1) | 42.5% | 34.4% |
| Interquartile 75% (IQ3) | 57.6% | 48.9% |
| Interquartile Range (IQR) | 15.1% | 14.5% |
| Standard Deviation (Sample) | 11.1% | 15.3% |
| Standard Deviation (Population) | 11.0% | 15.2% |
Similar Demographics by Associate's Degree
Demographics Similar to Ethiopians by Associate's Degree
In terms of associate's degree, the demographic groups most similar to Ethiopians are Immigrants from Eastern Europe (50.5%, a difference of 0.010%), Armenian (50.4%, a difference of 0.030%), Immigrants from Lebanon (50.5%, a difference of 0.060%), Immigrants from Zimbabwe (50.5%, a difference of 0.090%), and Maltese (50.4%, a difference of 0.10%).
| Demographics | Rating | Rank | Associate's Degree |
| Immigrants | Pakistan | 99.5 /100 | #72 | Exceptional 50.9% |
| Carpatho Rusyns | 99.3 /100 | #73 | Exceptional 50.6% |
| Lithuanians | 99.3 /100 | #74 | Exceptional 50.6% |
| Immigrants | Scotland | 99.3 /100 | #75 | Exceptional 50.6% |
| Immigrants | Zimbabwe | 99.2 /100 | #76 | Exceptional 50.5% |
| Immigrants | Lebanon | 99.1 /100 | #77 | Exceptional 50.5% |
| Immigrants | Eastern Europe | 99.1 /100 | #78 | Exceptional 50.5% |
| Ethiopians | 99.1 /100 | #79 | Exceptional 50.4% |
| Armenians | 99.1 /100 | #80 | Exceptional 50.4% |
| Maltese | 99.1 /100 | #81 | Exceptional 50.4% |
| Greeks | 98.9 /100 | #82 | Exceptional 50.3% |
| Immigrants | Uzbekistan | 98.9 /100 | #83 | Exceptional 50.3% |
| Immigrants | Hungary | 98.9 /100 | #84 | Exceptional 50.2% |
| Immigrants | Egypt | 98.9 /100 | #85 | Exceptional 50.2% |
| Immigrants | Croatia | 98.9 /100 | #86 | Exceptional 50.2% |
Demographics Similar to Poles by Associate's Degree
In terms of associate's degree, the demographic groups most similar to Poles are Immigrants from Eritrea (48.1%, a difference of 0.070%), Pakistani (48.1%, a difference of 0.11%), European (48.2%, a difference of 0.29%), Moroccan (48.2%, a difference of 0.35%), and Slovene (47.9%, a difference of 0.35%).
| Demographics | Rating | Rank | Associate's Degree |
| Icelanders | 90.8 /100 | #131 | Exceptional 48.3% |
| Immigrants | Albania | 89.9 /100 | #132 | Excellent 48.2% |
| Assyrians/Chaldeans/Syriacs | 89.4 /100 | #133 | Excellent 48.2% |
| Moroccans | 89.3 /100 | #134 | Excellent 48.2% |
| Europeans | 89.0 /100 | #135 | Excellent 48.2% |
| Pakistanis | 88.0 /100 | #136 | Excellent 48.1% |
| Immigrants | Eritrea | 87.8 /100 | #137 | Excellent 48.1% |
| Poles | 87.3 /100 | #138 | Excellent 48.0% |
| Slovenes | 85.1 /100 | #139 | Excellent 47.9% |
| Immigrants | Southern Europe | 84.4 /100 | #140 | Excellent 47.8% |
| Taiwanese | 83.3 /100 | #141 | Excellent 47.7% |
| Sierra Leoneans | 82.9 /100 | #142 | Excellent 47.7% |
| Norwegians | 81.0 /100 | #143 | Excellent 47.6% |
| Slavs | 80.5 /100 | #144 | Excellent 47.6% |
| Canadians | 79.0 /100 | #145 | Good 47.5% |