Ethiopian vs British West Indian Divorced or Separated
COMPARE
Ethiopian
British West Indian
Divorced or Separated
Divorced or Separated Comparison
Ethiopians
British West Indians
12.0%
DIVORCED OR SEPARATED
58.5/ 100
METRIC RATING
167th/ 347
METRIC RANK
12.4%
DIVORCED OR SEPARATED
3.7/ 100
METRIC RATING
240th/ 347
METRIC RANK
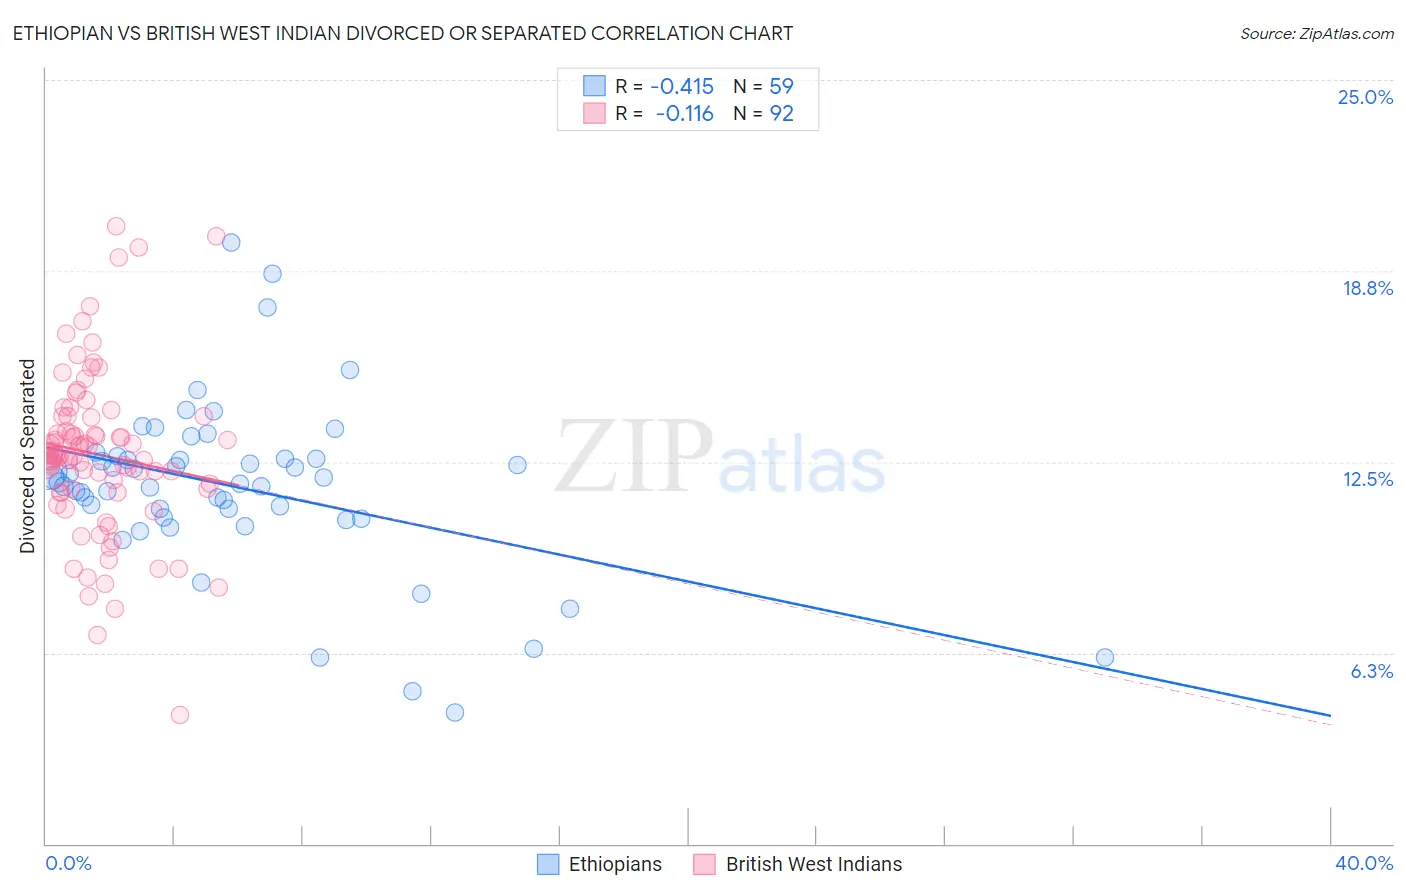
Ethiopian vs British West Indian Divorced or Separated Correlation Chart
The statistical analysis conducted on geographies consisting of 223,166,328 people shows a moderate negative correlation between the proportion of Ethiopians and percentage of population currently divorced or separated in the United States with a correlation coefficient (R) of -0.415 and weighted average of 12.0%. Similarly, the statistical analysis conducted on geographies consisting of 152,631,301 people shows a poor negative correlation between the proportion of British West Indians and percentage of population currently divorced or separated in the United States with a correlation coefficient (R) of -0.116 and weighted average of 12.4%, a difference of 3.1%.
Divorced or Separated Correlation Summary
| Measurement | Ethiopian | British West Indian |
| Minimum | 4.3% | 4.2% |
| Maximum | 19.7% | 20.2% |
| Range | 15.4% | 16.0% |
| Mean | 11.7% | 12.7% |
| Median | 11.8% | 12.7% |
| Interquartile 25% (IQ1) | 10.7% | 11.6% |
| Interquartile 75% (IQ3) | 12.6% | 14.0% |
| Interquartile Range (IQR) | 1.9% | 2.4% |
| Standard Deviation (Sample) | 2.8% | 2.7% |
| Standard Deviation (Population) | 2.8% | 2.7% |
Similar Demographics by Divorced or Separated
Demographics Similar to Ethiopians by Divorced or Separated
In terms of divorced or separated, the demographic groups most similar to Ethiopians are Serbian (12.0%, a difference of 0.050%), Immigrants from Peru (12.0%, a difference of 0.050%), Tohono O'odham (12.0%, a difference of 0.070%), Mexican American Indian (12.0%, a difference of 0.10%), and German Russian (12.0%, a difference of 0.12%).
| Demographics | Rating | Rank | Divorced or Separated |
| Immigrants | Scotland | 65.8 /100 | #160 | Good 12.0% |
| Marshallese | 64.6 /100 | #161 | Good 12.0% |
| Samoans | 64.3 /100 | #162 | Good 12.0% |
| Navajo | 63.9 /100 | #163 | Good 12.0% |
| Swiss | 63.6 /100 | #164 | Good 12.0% |
| German Russians | 61.8 /100 | #165 | Good 12.0% |
| Tohono O'odham | 60.4 /100 | #166 | Good 12.0% |
| Ethiopians | 58.5 /100 | #167 | Average 12.0% |
| Serbians | 57.1 /100 | #168 | Average 12.0% |
| Immigrants | Peru | 57.0 /100 | #169 | Average 12.0% |
| Mexican American Indians | 55.8 /100 | #170 | Average 12.0% |
| Costa Ricans | 53.3 /100 | #171 | Average 12.0% |
| Immigrants | Mexico | 53.2 /100 | #172 | Average 12.0% |
| Immigrants | Moldova | 50.4 /100 | #173 | Average 12.1% |
| Hawaiians | 50.0 /100 | #174 | Average 12.1% |
Demographics Similar to British West Indians by Divorced or Separated
In terms of divorced or separated, the demographic groups most similar to British West Indians are Immigrants from Germany (12.4%, a difference of 0.050%), Sudanese (12.4%, a difference of 0.060%), Immigrants from Laos (12.4%, a difference of 0.090%), Uruguayan (12.4%, a difference of 0.090%), and Colombian (12.4%, a difference of 0.10%).
| Demographics | Rating | Rank | Divorced or Separated |
| Malaysians | 4.8 /100 | #233 | Tragic 12.4% |
| West Indians | 4.4 /100 | #234 | Tragic 12.4% |
| Immigrants | Bosnia and Herzegovina | 4.3 /100 | #235 | Tragic 12.4% |
| Colombians | 4.2 /100 | #236 | Tragic 12.4% |
| Immigrants | Laos | 4.2 /100 | #237 | Tragic 12.4% |
| Sudanese | 4.0 /100 | #238 | Tragic 12.4% |
| Immigrants | Germany | 4.0 /100 | #239 | Tragic 12.4% |
| British West Indians | 3.7 /100 | #240 | Tragic 12.4% |
| Uruguayans | 3.4 /100 | #241 | Tragic 12.4% |
| Dutch | 3.1 /100 | #242 | Tragic 12.4% |
| Immigrants | Latin America | 2.8 /100 | #243 | Tragic 12.4% |
| Alaska Natives | 2.5 /100 | #244 | Tragic 12.4% |
| Hispanics or Latinos | 2.0 /100 | #245 | Tragic 12.5% |
| Immigrants | West Indies | 1.9 /100 | #246 | Tragic 12.5% |
| Germans | 1.8 /100 | #247 | Tragic 12.5% |