Immigrants from Caribbean vs Polish Divorced or Separated
COMPARE
Immigrants from Caribbean
Polish
Divorced or Separated
Divorced or Separated Comparison
Immigrants from Caribbean
Poles
13.6%
DIVORCED OR SEPARATED
0.0/ 100
METRIC RATING
328th/ 347
METRIC RANK
11.9%
DIVORCED OR SEPARATED
78.6/ 100
METRIC RATING
147th/ 347
METRIC RANK
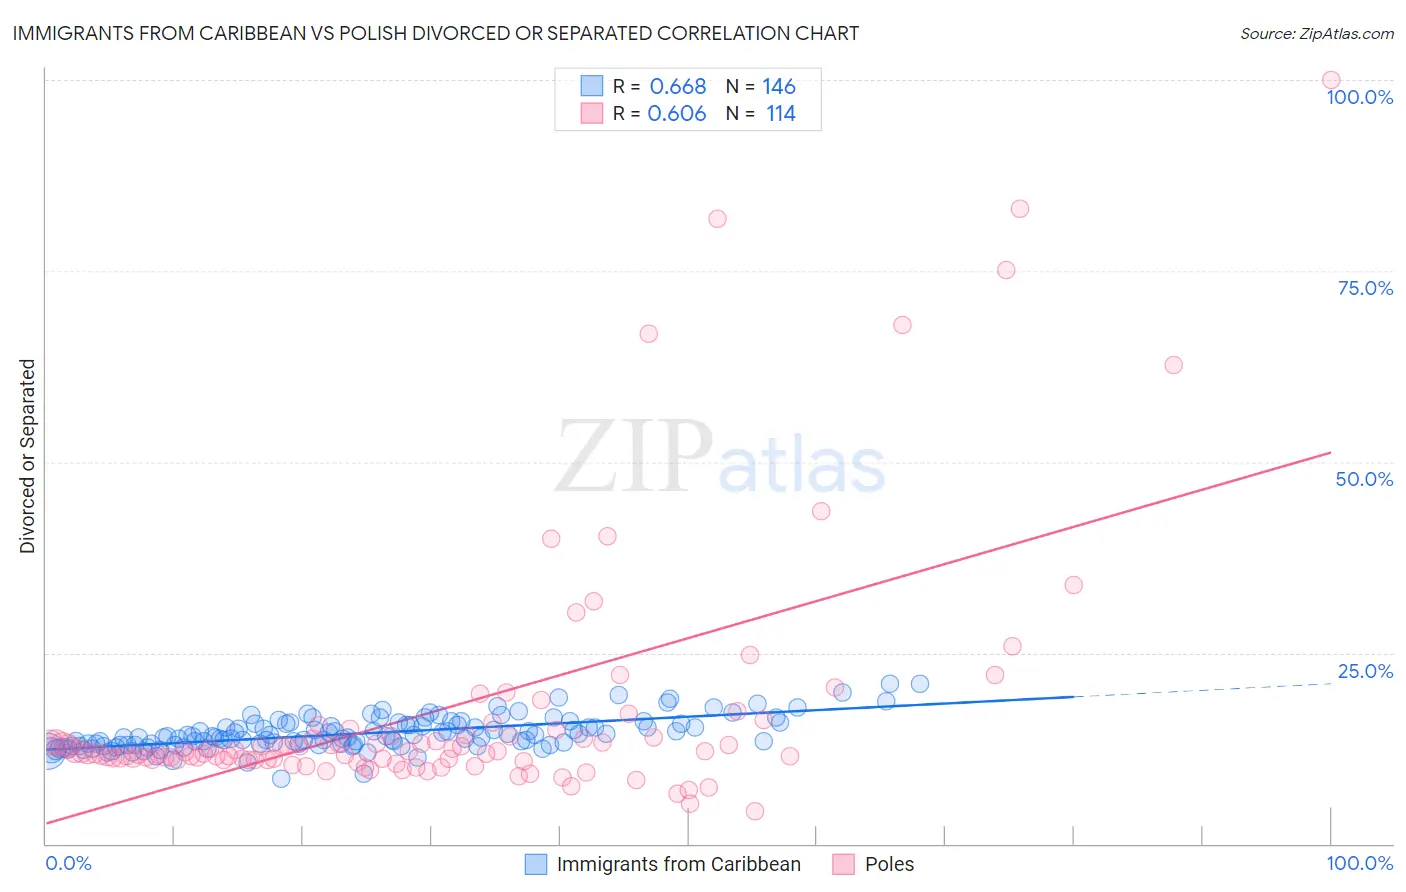
Immigrants from Caribbean vs Polish Divorced or Separated Correlation Chart
The statistical analysis conducted on geographies consisting of 449,832,030 people shows a significant positive correlation between the proportion of Immigrants from Caribbean and percentage of population currently divorced or separated in the United States with a correlation coefficient (R) of 0.668 and weighted average of 13.6%. Similarly, the statistical analysis conducted on geographies consisting of 560,123,117 people shows a significant positive correlation between the proportion of Poles and percentage of population currently divorced or separated in the United States with a correlation coefficient (R) of 0.606 and weighted average of 11.9%, a difference of 13.9%.
Divorced or Separated Correlation Summary
| Measurement | Immigrants from Caribbean | Polish |
| Minimum | 8.5% | 4.3% |
| Maximum | 21.0% | 100.0% |
| Range | 12.5% | 95.7% |
| Mean | 14.4% | 17.6% |
| Median | 14.0% | 12.1% |
| Interquartile 25% (IQ1) | 13.0% | 11.0% |
| Interquartile 75% (IQ3) | 15.7% | 14.3% |
| Interquartile Range (IQR) | 2.7% | 3.2% |
| Standard Deviation (Sample) | 2.1% | 16.8% |
| Standard Deviation (Population) | 2.1% | 16.7% |
Similar Demographics by Divorced or Separated
Demographics Similar to Immigrants from Caribbean by Divorced or Separated
In terms of divorced or separated, the demographic groups most similar to Immigrants from Caribbean are Houma (13.6%, a difference of 0.15%), Paiute (13.6%, a difference of 0.26%), Comanche (13.5%, a difference of 0.38%), Black/African American (13.6%, a difference of 0.39%), and Immigrants from Congo (13.5%, a difference of 0.86%).
| Demographics | Rating | Rank | Divorced or Separated |
| Cheyenne | 0.0 /100 | #321 | Tragic 13.4% |
| Immigrants | Haiti | 0.0 /100 | #322 | Tragic 13.4% |
| U.S. Virgin Islanders | 0.0 /100 | #323 | Tragic 13.4% |
| Osage | 0.0 /100 | #324 | Tragic 13.4% |
| Potawatomi | 0.0 /100 | #325 | Tragic 13.5% |
| Immigrants | Congo | 0.0 /100 | #326 | Tragic 13.5% |
| Comanche | 0.0 /100 | #327 | Tragic 13.5% |
| Immigrants | Caribbean | 0.0 /100 | #328 | Tragic 13.6% |
| Houma | 0.0 /100 | #329 | Tragic 13.6% |
| Paiute | 0.0 /100 | #330 | Tragic 13.6% |
| Blacks/African Americans | 0.0 /100 | #331 | Tragic 13.6% |
| Cherokee | 0.0 /100 | #332 | Tragic 13.7% |
| Puerto Ricans | 0.0 /100 | #333 | Tragic 13.9% |
| Immigrants | Bahamas | 0.0 /100 | #334 | Tragic 13.9% |
| Dutch West Indians | 0.0 /100 | #335 | Tragic 14.0% |
Demographics Similar to Poles by Divorced or Separated
In terms of divorced or separated, the demographic groups most similar to Poles are Immigrants from Grenada (11.9%, a difference of 0.030%), Italian (11.9%, a difference of 0.040%), Immigrants from Oceania (11.9%, a difference of 0.050%), Immigrants from Portugal (11.9%, a difference of 0.070%), and Croatian (11.9%, a difference of 0.11%).
| Demographics | Rating | Rank | Divorced or Separated |
| Lebanese | 83.4 /100 | #140 | Excellent 11.9% |
| Immigrants | Morocco | 82.9 /100 | #141 | Excellent 11.9% |
| Immigrants | Zimbabwe | 81.5 /100 | #142 | Excellent 11.9% |
| Pakistanis | 81.3 /100 | #143 | Excellent 11.9% |
| Peruvians | 80.9 /100 | #144 | Excellent 11.9% |
| Croatians | 80.6 /100 | #145 | Excellent 11.9% |
| Immigrants | Grenada | 79.1 /100 | #146 | Good 11.9% |
| Poles | 78.6 /100 | #147 | Good 11.9% |
| Italians | 77.8 /100 | #148 | Good 11.9% |
| Immigrants | Oceania | 77.7 /100 | #149 | Good 11.9% |
| Immigrants | Portugal | 77.3 /100 | #150 | Good 11.9% |
| Czechs | 76.4 /100 | #151 | Good 11.9% |
| Immigrants | Hungary | 73.7 /100 | #152 | Good 11.9% |
| Austrians | 72.2 /100 | #153 | Good 12.0% |
| Chileans | 71.3 /100 | #154 | Good 12.0% |