Ethiopian vs Arab Divorced or Separated
COMPARE
Ethiopian
Arab
Divorced or Separated
Divorced or Separated Comparison
Ethiopians
Arabs
12.0%
DIVORCED OR SEPARATED
58.5/ 100
METRIC RATING
167th/ 347
METRIC RANK
11.6%
DIVORCED OR SEPARATED
98.9/ 100
METRIC RATING
93rd/ 347
METRIC RANK
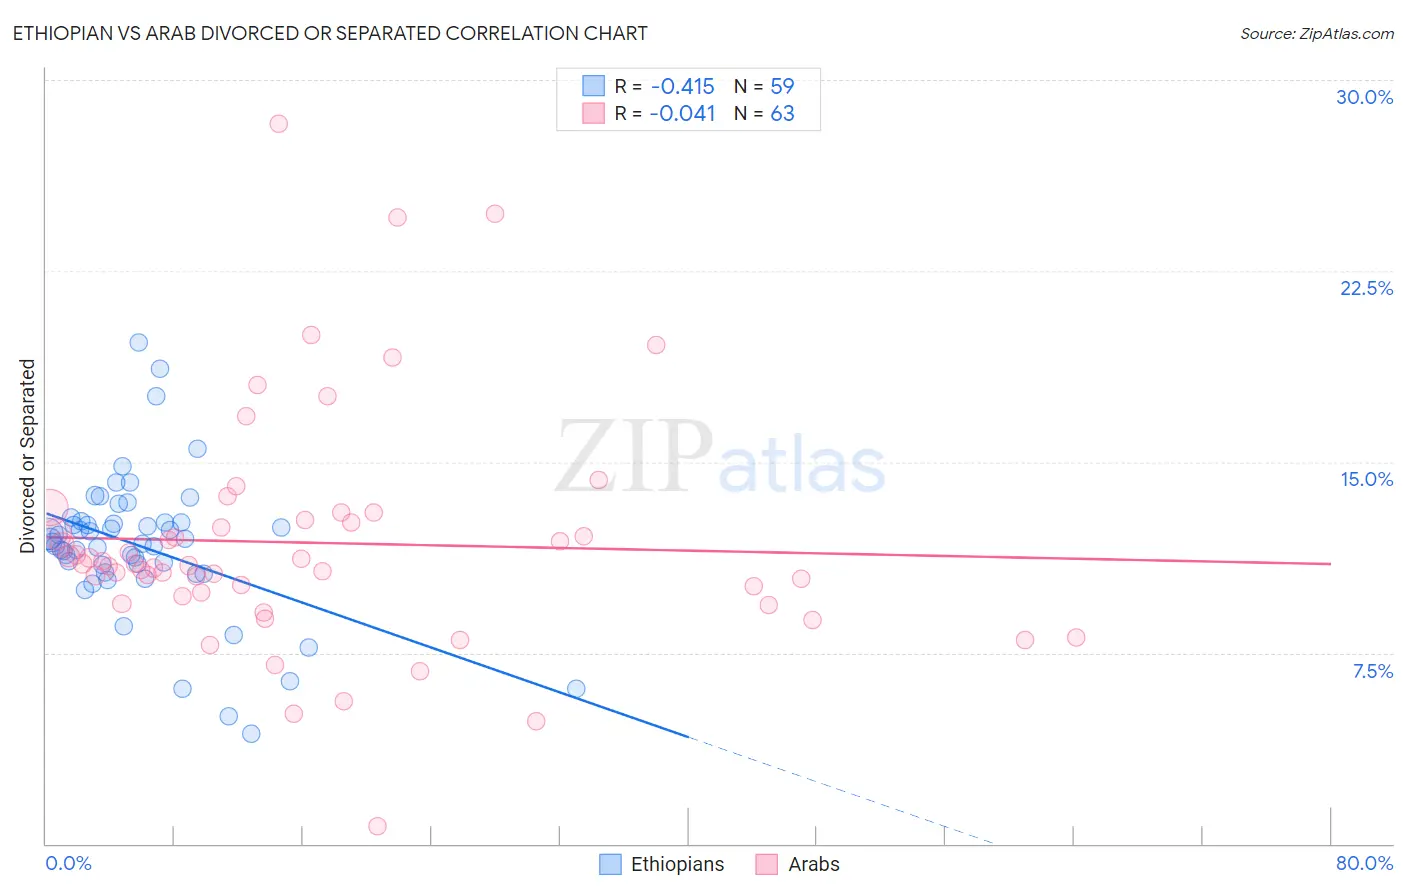
Ethiopian vs Arab Divorced or Separated Correlation Chart
The statistical analysis conducted on geographies consisting of 223,166,328 people shows a moderate negative correlation between the proportion of Ethiopians and percentage of population currently divorced or separated in the United States with a correlation coefficient (R) of -0.415 and weighted average of 12.0%. Similarly, the statistical analysis conducted on geographies consisting of 486,549,108 people shows no correlation between the proportion of Arabs and percentage of population currently divorced or separated in the United States with a correlation coefficient (R) of -0.041 and weighted average of 11.6%, a difference of 3.7%.
Divorced or Separated Correlation Summary
| Measurement | Ethiopian | Arab |
| Minimum | 4.3% | 0.70% |
| Maximum | 19.7% | 28.3% |
| Range | 15.4% | 27.6% |
| Mean | 11.7% | 11.8% |
| Median | 11.8% | 11.0% |
| Interquartile 25% (IQ1) | 10.7% | 9.7% |
| Interquartile 75% (IQ3) | 12.6% | 12.7% |
| Interquartile Range (IQR) | 1.9% | 3.0% |
| Standard Deviation (Sample) | 2.8% | 4.6% |
| Standard Deviation (Population) | 2.8% | 4.6% |
Similar Demographics by Divorced or Separated
Demographics Similar to Ethiopians by Divorced or Separated
In terms of divorced or separated, the demographic groups most similar to Ethiopians are Serbian (12.0%, a difference of 0.050%), Immigrants from Peru (12.0%, a difference of 0.050%), Tohono O'odham (12.0%, a difference of 0.070%), Mexican American Indian (12.0%, a difference of 0.10%), and German Russian (12.0%, a difference of 0.12%).
| Demographics | Rating | Rank | Divorced or Separated |
| Immigrants | Scotland | 65.8 /100 | #160 | Good 12.0% |
| Marshallese | 64.6 /100 | #161 | Good 12.0% |
| Samoans | 64.3 /100 | #162 | Good 12.0% |
| Navajo | 63.9 /100 | #163 | Good 12.0% |
| Swiss | 63.6 /100 | #164 | Good 12.0% |
| German Russians | 61.8 /100 | #165 | Good 12.0% |
| Tohono O'odham | 60.4 /100 | #166 | Good 12.0% |
| Ethiopians | 58.5 /100 | #167 | Average 12.0% |
| Serbians | 57.1 /100 | #168 | Average 12.0% |
| Immigrants | Peru | 57.0 /100 | #169 | Average 12.0% |
| Mexican American Indians | 55.8 /100 | #170 | Average 12.0% |
| Costa Ricans | 53.3 /100 | #171 | Average 12.0% |
| Immigrants | Mexico | 53.2 /100 | #172 | Average 12.0% |
| Immigrants | Moldova | 50.4 /100 | #173 | Average 12.1% |
| Hawaiians | 50.0 /100 | #174 | Average 12.1% |
Demographics Similar to Arabs by Divorced or Separated
In terms of divorced or separated, the demographic groups most similar to Arabs are Immigrants from Denmark (11.6%, a difference of 0.0%), Immigrants from Fiji (11.6%, a difference of 0.010%), Spanish American Indian (11.6%, a difference of 0.060%), Zimbabwean (11.6%, a difference of 0.10%), and Immigrants from Serbia (11.6%, a difference of 0.11%).
| Demographics | Rating | Rank | Divorced or Separated |
| Immigrants | Latvia | 99.2 /100 | #86 | Exceptional 11.6% |
| Immigrants | Nepal | 99.2 /100 | #87 | Exceptional 11.6% |
| Immigrants | Europe | 99.2 /100 | #88 | Exceptional 11.6% |
| Immigrants | Southern Europe | 99.1 /100 | #89 | Exceptional 11.6% |
| Zimbabweans | 99.0 /100 | #90 | Exceptional 11.6% |
| Spanish American Indians | 99.0 /100 | #91 | Exceptional 11.6% |
| Immigrants | Denmark | 98.9 /100 | #92 | Exceptional 11.6% |
| Arabs | 98.9 /100 | #93 | Exceptional 11.6% |
| Immigrants | Fiji | 98.9 /100 | #94 | Exceptional 11.6% |
| Immigrants | Serbia | 98.8 /100 | #95 | Exceptional 11.6% |
| Immigrants | Ukraine | 98.7 /100 | #96 | Exceptional 11.6% |
| Latvians | 98.7 /100 | #97 | Exceptional 11.6% |
| Immigrants | Jordan | 98.6 /100 | #98 | Exceptional 11.6% |
| Immigrants | Sweden | 98.6 /100 | #99 | Exceptional 11.6% |
| Immigrants | Northern Europe | 98.6 /100 | #100 | Exceptional 11.6% |