Ethiopian vs Polish 2nd Grade
COMPARE
Ethiopian
Polish
2nd Grade
2nd Grade Comparison
Ethiopians
Poles
97.5%
2ND GRADE
1.2/ 100
METRIC RATING
241st/ 347
METRIC RANK
98.5%
2ND GRADE
100.0/ 100
METRIC RATING
22nd/ 347
METRIC RANK
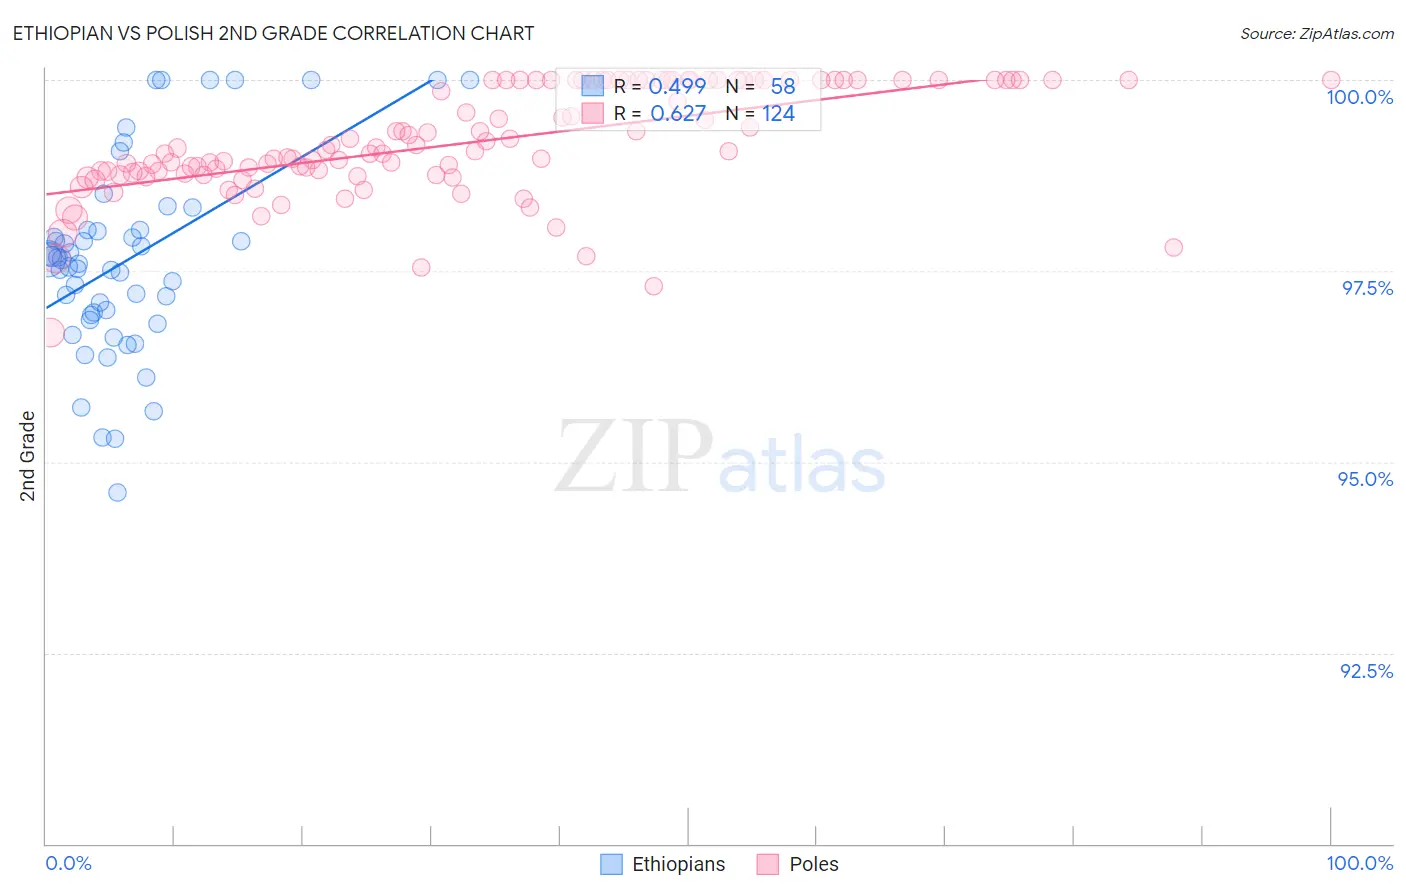
Ethiopian vs Polish 2nd Grade Correlation Chart
The statistical analysis conducted on geographies consisting of 223,120,541 people shows a moderate positive correlation between the proportion of Ethiopians and percentage of population with at least 2nd grade education in the United States with a correlation coefficient (R) of 0.499 and weighted average of 97.5%. Similarly, the statistical analysis conducted on geographies consisting of 560,594,514 people shows a significant positive correlation between the proportion of Poles and percentage of population with at least 2nd grade education in the United States with a correlation coefficient (R) of 0.627 and weighted average of 98.5%, a difference of 1.0%.
2nd Grade Correlation Summary
| Measurement | Ethiopian | Polish |
| Minimum | 94.6% | 96.7% |
| Maximum | 100.0% | 100.0% |
| Range | 5.4% | 3.3% |
| Mean | 97.6% | 99.2% |
| Median | 97.6% | 99.1% |
| Interquartile 25% (IQ1) | 96.9% | 98.8% |
| Interquartile 75% (IQ3) | 98.0% | 100.0% |
| Interquartile Range (IQR) | 1.1% | 1.2% |
| Standard Deviation (Sample) | 1.3% | 0.71% |
| Standard Deviation (Population) | 1.2% | 0.70% |
Similar Demographics by 2nd Grade
Demographics Similar to Ethiopians by 2nd Grade
In terms of 2nd grade, the demographic groups most similar to Ethiopians are Immigrants from Indonesia (97.5%, a difference of 0.0%), Korean (97.5%, a difference of 0.010%), Asian (97.5%, a difference of 0.010%), Nigerian (97.6%, a difference of 0.020%), and U.S. Virgin Islander (97.6%, a difference of 0.020%).
| Demographics | Rating | Rank | 2nd Grade |
| Immigrants | Malaysia | 2.0 /100 | #234 | Tragic 97.6% |
| Colombians | 1.9 /100 | #235 | Tragic 97.6% |
| Nigerians | 1.7 /100 | #236 | Tragic 97.6% |
| U.S. Virgin Islanders | 1.6 /100 | #237 | Tragic 97.6% |
| Immigrants | Eastern Asia | 1.6 /100 | #238 | Tragic 97.6% |
| Liberians | 1.6 /100 | #239 | Tragic 97.6% |
| Koreans | 1.5 /100 | #240 | Tragic 97.5% |
| Ethiopians | 1.2 /100 | #241 | Tragic 97.5% |
| Immigrants | Indonesia | 1.2 /100 | #242 | Tragic 97.5% |
| Asians | 1.1 /100 | #243 | Tragic 97.5% |
| Immigrants | Iraq | 1.0 /100 | #244 | Tragic 97.5% |
| Immigrants | Eastern Africa | 0.9 /100 | #245 | Tragic 97.5% |
| South Americans | 0.9 /100 | #246 | Tragic 97.5% |
| Immigrants | Senegal | 0.9 /100 | #247 | Tragic 97.5% |
| Immigrants | Middle Africa | 0.9 /100 | #248 | Tragic 97.5% |
Demographics Similar to Poles by 2nd Grade
In terms of 2nd grade, the demographic groups most similar to Poles are Finnish (98.5%, a difference of 0.0%), Sioux (98.5%, a difference of 0.0%), Lithuanian (98.5%, a difference of 0.0%), Danish (98.5%, a difference of 0.0%), and Pennsylvania German (98.5%, a difference of 0.0%).
| Demographics | Rating | Rank | 2nd Grade |
| Scottish | 100.0 /100 | #15 | Exceptional 98.6% |
| Dutch | 100.0 /100 | #16 | Exceptional 98.6% |
| Aleuts | 100.0 /100 | #17 | Exceptional 98.6% |
| Irish | 100.0 /100 | #18 | Exceptional 98.6% |
| Finns | 100.0 /100 | #19 | Exceptional 98.5% |
| Sioux | 100.0 /100 | #20 | Exceptional 98.5% |
| Lithuanians | 100.0 /100 | #21 | Exceptional 98.5% |
| Poles | 100.0 /100 | #22 | Exceptional 98.5% |
| Danes | 100.0 /100 | #23 | Exceptional 98.5% |
| Pennsylvania Germans | 100.0 /100 | #24 | Exceptional 98.5% |
| Scotch-Irish | 100.0 /100 | #25 | Exceptional 98.5% |
| Welsh | 100.0 /100 | #26 | Exceptional 98.5% |
| Croatians | 100.0 /100 | #27 | Exceptional 98.5% |
| Arapaho | 100.0 /100 | #28 | Exceptional 98.5% |
| French | 100.0 /100 | #29 | Exceptional 98.5% |