Ethiopian vs Polish Master's Degree
COMPARE
Ethiopian
Polish
Master's Degree
Master's Degree Comparison
Ethiopians
Poles
18.0%
MASTER'S DEGREE
99.8/ 100
METRIC RATING
66th/ 347
METRIC RANK
15.7%
MASTER'S DEGREE
85.0/ 100
METRIC RATING
141st/ 347
METRIC RANK
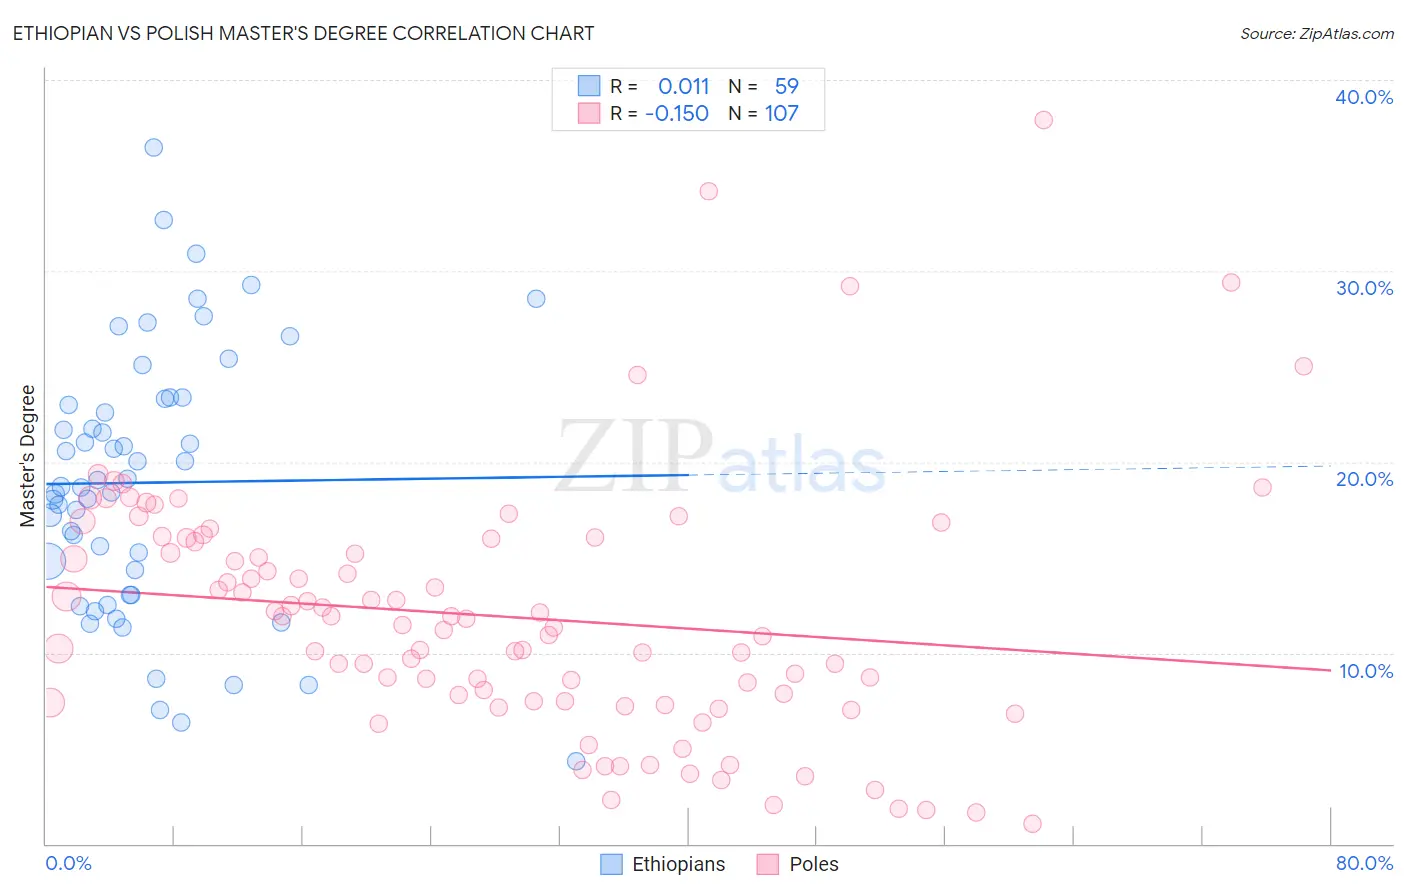
Ethiopian vs Polish Master's Degree Correlation Chart
The statistical analysis conducted on geographies consisting of 223,155,116 people shows no correlation between the proportion of Ethiopians and percentage of population with at least master's degree education in the United States with a correlation coefficient (R) of 0.011 and weighted average of 18.0%. Similarly, the statistical analysis conducted on geographies consisting of 559,882,025 people shows a poor negative correlation between the proportion of Poles and percentage of population with at least master's degree education in the United States with a correlation coefficient (R) of -0.150 and weighted average of 15.7%, a difference of 14.1%.
Master's Degree Correlation Summary
| Measurement | Ethiopian | Polish |
| Minimum | 4.3% | 1.0% |
| Maximum | 36.4% | 37.9% |
| Range | 32.1% | 36.9% |
| Mean | 18.9% | 11.9% |
| Median | 18.7% | 11.5% |
| Interquartile 25% (IQ1) | 13.1% | 7.4% |
| Interquartile 75% (IQ3) | 23.3% | 16.0% |
| Interquartile Range (IQR) | 10.2% | 8.5% |
| Standard Deviation (Sample) | 6.9% | 6.6% |
| Standard Deviation (Population) | 6.8% | 6.6% |
Similar Demographics by Master's Degree
Demographics Similar to Ethiopians by Master's Degree
In terms of master's degree, the demographic groups most similar to Ethiopians are Immigrants from Kazakhstan (18.0%, a difference of 0.020%), Immigrants from Argentina (18.0%, a difference of 0.050%), Immigrants from Ethiopia (17.9%, a difference of 0.27%), Immigrants from Uzbekistan (17.9%, a difference of 0.60%), and South African (18.1%, a difference of 0.73%).
| Demographics | Rating | Rank | Master's Degree |
| Immigrants | Bulgaria | 99.9 /100 | #59 | Exceptional 18.3% |
| New Zealanders | 99.9 /100 | #60 | Exceptional 18.3% |
| Immigrants | Europe | 99.9 /100 | #61 | Exceptional 18.2% |
| Argentineans | 99.9 /100 | #62 | Exceptional 18.2% |
| Immigrants | Netherlands | 99.9 /100 | #63 | Exceptional 18.1% |
| South Africans | 99.9 /100 | #64 | Exceptional 18.1% |
| Immigrants | Kazakhstan | 99.8 /100 | #65 | Exceptional 18.0% |
| Ethiopians | 99.8 /100 | #66 | Exceptional 18.0% |
| Immigrants | Argentina | 99.8 /100 | #67 | Exceptional 18.0% |
| Immigrants | Ethiopia | 99.8 /100 | #68 | Exceptional 17.9% |
| Immigrants | Uzbekistan | 99.8 /100 | #69 | Exceptional 17.9% |
| Immigrants | Western Europe | 99.8 /100 | #70 | Exceptional 17.8% |
| Immigrants | Pakistan | 99.7 /100 | #71 | Exceptional 17.8% |
| Lithuanians | 99.7 /100 | #72 | Exceptional 17.7% |
| Zimbabweans | 99.7 /100 | #73 | Exceptional 17.7% |
Demographics Similar to Poles by Master's Degree
In terms of master's degree, the demographic groups most similar to Poles are Vietnamese (15.8%, a difference of 0.12%), Immigrants from Germany (15.8%, a difference of 0.21%), Immigrants from Africa (15.7%, a difference of 0.23%), Pakistani (15.8%, a difference of 0.27%), and Immigrants from Venezuela (15.7%, a difference of 0.32%).
| Demographics | Rating | Rank | Master's Degree |
| Venezuelans | 88.4 /100 | #134 | Excellent 15.9% |
| South American Indians | 88.4 /100 | #135 | Excellent 15.9% |
| Assyrians/Chaldeans/Syriacs | 86.8 /100 | #136 | Excellent 15.8% |
| Europeans | 86.4 /100 | #137 | Excellent 15.8% |
| Pakistanis | 86.1 /100 | #138 | Excellent 15.8% |
| Immigrants | Germany | 85.9 /100 | #139 | Excellent 15.8% |
| Vietnamese | 85.5 /100 | #140 | Excellent 15.8% |
| Poles | 85.0 /100 | #141 | Excellent 15.7% |
| Immigrants | Africa | 84.0 /100 | #142 | Excellent 15.7% |
| Immigrants | Venezuela | 83.6 /100 | #143 | Excellent 15.7% |
| Canadians | 83.3 /100 | #144 | Excellent 15.7% |
| South Americans | 81.3 /100 | #145 | Excellent 15.6% |
| Immigrants | Afghanistan | 79.4 /100 | #146 | Good 15.6% |
| Hungarians | 79.1 /100 | #147 | Good 15.6% |
| Immigrants | Senegal | 78.2 /100 | #148 | Good 15.5% |