Ethiopian vs Immigrants from Norway Divorced or Separated
COMPARE
Ethiopian
Immigrants from Norway
Divorced or Separated
Divorced or Separated Comparison
Ethiopians
Immigrants from Norway
12.0%
DIVORCED OR SEPARATED
58.5/ 100
METRIC RATING
167th/ 347
METRIC RANK
11.7%
DIVORCED OR SEPARATED
95.9/ 100
METRIC RATING
114th/ 347
METRIC RANK
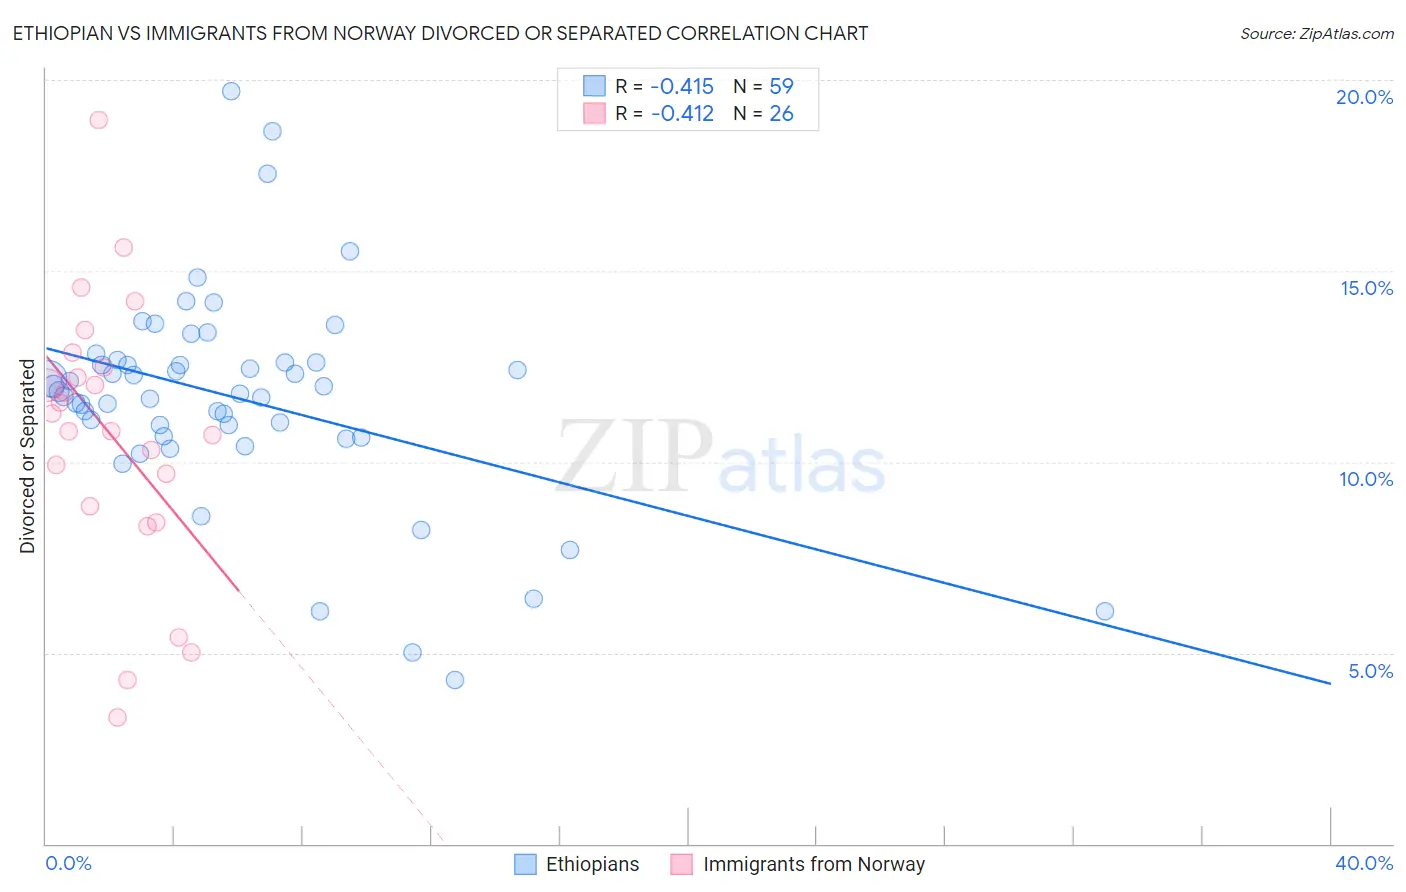
Ethiopian vs Immigrants from Norway Divorced or Separated Correlation Chart
The statistical analysis conducted on geographies consisting of 223,166,328 people shows a moderate negative correlation between the proportion of Ethiopians and percentage of population currently divorced or separated in the United States with a correlation coefficient (R) of -0.415 and weighted average of 12.0%. Similarly, the statistical analysis conducted on geographies consisting of 116,710,003 people shows a moderate negative correlation between the proportion of Immigrants from Norway and percentage of population currently divorced or separated in the United States with a correlation coefficient (R) of -0.412 and weighted average of 11.7%, a difference of 2.5%.
Divorced or Separated Correlation Summary
| Measurement | Ethiopian | Immigrants from Norway |
| Minimum | 4.3% | 3.3% |
| Maximum | 19.7% | 18.9% |
| Range | 15.4% | 15.6% |
| Mean | 11.7% | 10.7% |
| Median | 11.8% | 11.0% |
| Interquartile 25% (IQ1) | 10.7% | 8.8% |
| Interquartile 75% (IQ3) | 12.6% | 12.5% |
| Interquartile Range (IQR) | 1.9% | 3.6% |
| Standard Deviation (Sample) | 2.8% | 3.6% |
| Standard Deviation (Population) | 2.8% | 3.5% |
Similar Demographics by Divorced or Separated
Demographics Similar to Ethiopians by Divorced or Separated
In terms of divorced or separated, the demographic groups most similar to Ethiopians are Serbian (12.0%, a difference of 0.050%), Immigrants from Peru (12.0%, a difference of 0.050%), Tohono O'odham (12.0%, a difference of 0.070%), Mexican American Indian (12.0%, a difference of 0.10%), and German Russian (12.0%, a difference of 0.12%).
| Demographics | Rating | Rank | Divorced or Separated |
| Immigrants | Scotland | 65.8 /100 | #160 | Good 12.0% |
| Marshallese | 64.6 /100 | #161 | Good 12.0% |
| Samoans | 64.3 /100 | #162 | Good 12.0% |
| Navajo | 63.9 /100 | #163 | Good 12.0% |
| Swiss | 63.6 /100 | #164 | Good 12.0% |
| German Russians | 61.8 /100 | #165 | Good 12.0% |
| Tohono O'odham | 60.4 /100 | #166 | Good 12.0% |
| Ethiopians | 58.5 /100 | #167 | Average 12.0% |
| Serbians | 57.1 /100 | #168 | Average 12.0% |
| Immigrants | Peru | 57.0 /100 | #169 | Average 12.0% |
| Mexican American Indians | 55.8 /100 | #170 | Average 12.0% |
| Costa Ricans | 53.3 /100 | #171 | Average 12.0% |
| Immigrants | Mexico | 53.2 /100 | #172 | Average 12.0% |
| Immigrants | Moldova | 50.4 /100 | #173 | Average 12.1% |
| Hawaiians | 50.0 /100 | #174 | Average 12.1% |
Demographics Similar to Immigrants from Norway by Divorced or Separated
In terms of divorced or separated, the demographic groups most similar to Immigrants from Norway are Lithuanian (11.7%, a difference of 0.050%), Immigrants from Iraq (11.7%, a difference of 0.12%), Immigrants from Uganda (11.7%, a difference of 0.13%), Ecuadorian (11.7%, a difference of 0.14%), and Immigrants from France (11.7%, a difference of 0.17%).
| Demographics | Rating | Rank | Divorced or Separated |
| Native Hawaiians | 97.2 /100 | #107 | Exceptional 11.7% |
| Greeks | 96.9 /100 | #108 | Exceptional 11.7% |
| Immigrants | South Africa | 96.9 /100 | #109 | Exceptional 11.7% |
| Immigrants | Czechoslovakia | 96.9 /100 | #110 | Exceptional 11.7% |
| Immigrants | Spain | 96.8 /100 | #111 | Exceptional 11.7% |
| Immigrants | France | 96.6 /100 | #112 | Exceptional 11.7% |
| Estonians | 96.6 /100 | #113 | Exceptional 11.7% |
| Immigrants | Norway | 95.9 /100 | #114 | Exceptional 11.7% |
| Lithuanians | 95.7 /100 | #115 | Exceptional 11.7% |
| Immigrants | Iraq | 95.4 /100 | #116 | Exceptional 11.7% |
| Immigrants | Uganda | 95.3 /100 | #117 | Exceptional 11.7% |
| Ecuadorians | 95.3 /100 | #118 | Exceptional 11.7% |
| Syrians | 95.1 /100 | #119 | Exceptional 11.7% |
| Iraqis | 94.6 /100 | #120 | Exceptional 11.8% |
| Romanians | 94.5 /100 | #121 | Exceptional 11.8% |