Ethiopian vs Tsimshian Divorced or Separated
COMPARE
Ethiopian
Tsimshian
Divorced or Separated
Divorced or Separated Comparison
Ethiopians
Tsimshian
12.0%
DIVORCED OR SEPARATED
58.5/ 100
METRIC RATING
167th/ 347
METRIC RANK
13.3%
DIVORCED OR SEPARATED
0.0/ 100
METRIC RATING
316th/ 347
METRIC RANK
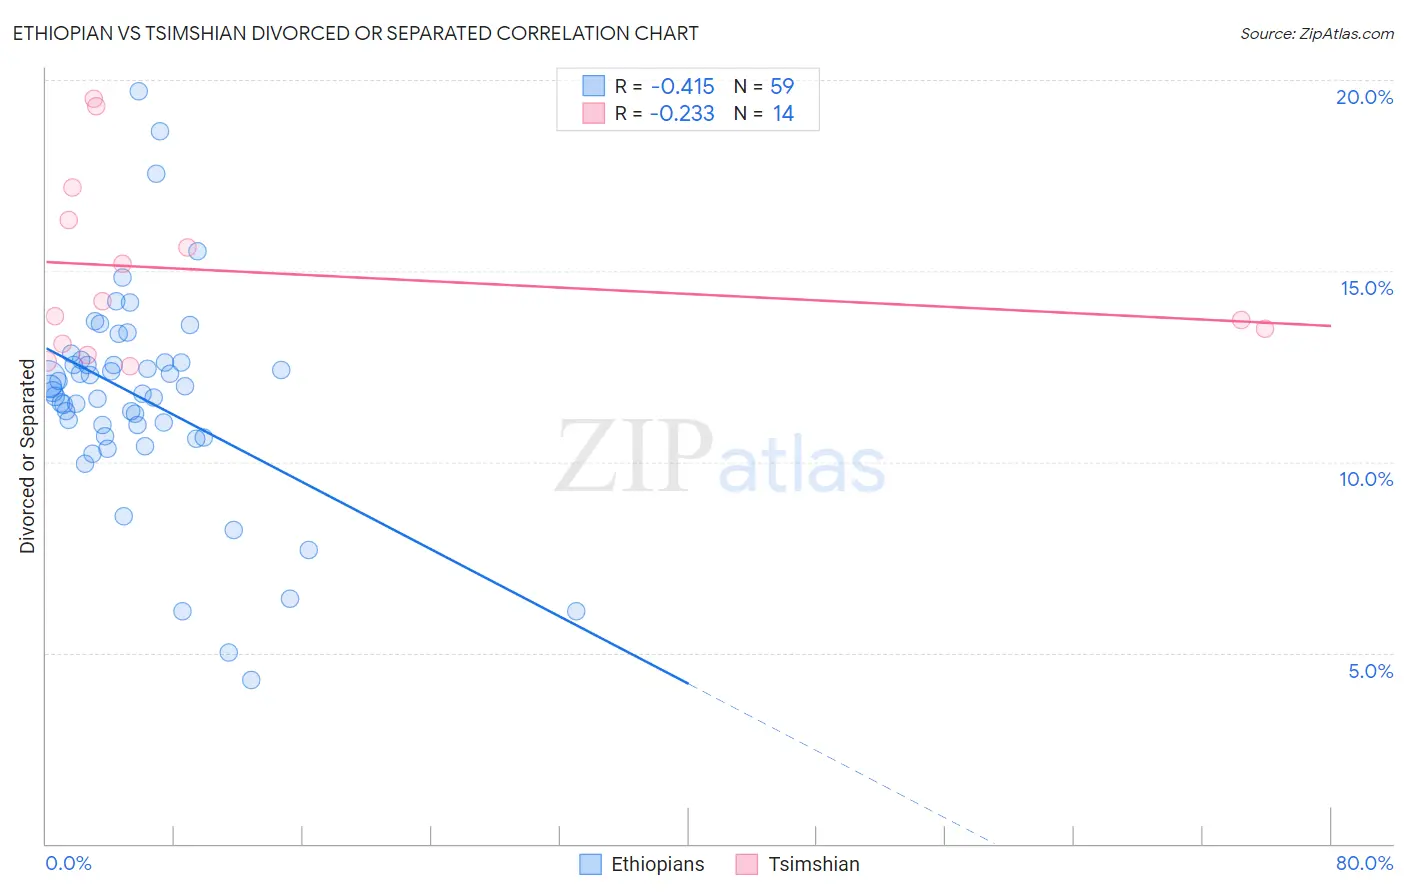
Ethiopian vs Tsimshian Divorced or Separated Correlation Chart
The statistical analysis conducted on geographies consisting of 223,166,328 people shows a moderate negative correlation between the proportion of Ethiopians and percentage of population currently divorced or separated in the United States with a correlation coefficient (R) of -0.415 and weighted average of 12.0%. Similarly, the statistical analysis conducted on geographies consisting of 15,626,183 people shows a weak negative correlation between the proportion of Tsimshian and percentage of population currently divorced or separated in the United States with a correlation coefficient (R) of -0.233 and weighted average of 13.3%, a difference of 11.0%.
Divorced or Separated Correlation Summary
| Measurement | Ethiopian | Tsimshian |
| Minimum | 4.3% | 12.5% |
| Maximum | 19.7% | 19.5% |
| Range | 15.4% | 7.0% |
| Mean | 11.7% | 15.0% |
| Median | 11.8% | 14.0% |
| Interquartile 25% (IQ1) | 10.7% | 13.1% |
| Interquartile 75% (IQ3) | 12.6% | 16.3% |
| Interquartile Range (IQR) | 1.9% | 3.2% |
| Standard Deviation (Sample) | 2.8% | 2.4% |
| Standard Deviation (Population) | 2.8% | 2.3% |
Similar Demographics by Divorced or Separated
Demographics Similar to Ethiopians by Divorced or Separated
In terms of divorced or separated, the demographic groups most similar to Ethiopians are Serbian (12.0%, a difference of 0.050%), Immigrants from Peru (12.0%, a difference of 0.050%), Tohono O'odham (12.0%, a difference of 0.070%), Mexican American Indian (12.0%, a difference of 0.10%), and German Russian (12.0%, a difference of 0.12%).
| Demographics | Rating | Rank | Divorced or Separated |
| Immigrants | Scotland | 65.8 /100 | #160 | Good 12.0% |
| Marshallese | 64.6 /100 | #161 | Good 12.0% |
| Samoans | 64.3 /100 | #162 | Good 12.0% |
| Navajo | 63.9 /100 | #163 | Good 12.0% |
| Swiss | 63.6 /100 | #164 | Good 12.0% |
| German Russians | 61.8 /100 | #165 | Good 12.0% |
| Tohono O'odham | 60.4 /100 | #166 | Good 12.0% |
| Ethiopians | 58.5 /100 | #167 | Average 12.0% |
| Serbians | 57.1 /100 | #168 | Average 12.0% |
| Immigrants | Peru | 57.0 /100 | #169 | Average 12.0% |
| Mexican American Indians | 55.8 /100 | #170 | Average 12.0% |
| Costa Ricans | 53.3 /100 | #171 | Average 12.0% |
| Immigrants | Mexico | 53.2 /100 | #172 | Average 12.0% |
| Immigrants | Moldova | 50.4 /100 | #173 | Average 12.1% |
| Hawaiians | 50.0 /100 | #174 | Average 12.1% |
Demographics Similar to Tsimshian by Divorced or Separated
In terms of divorced or separated, the demographic groups most similar to Tsimshian are Haitian (13.3%, a difference of 0.020%), Spanish American (13.3%, a difference of 0.030%), Cree (13.4%, a difference of 0.050%), Puget Sound Salish (13.4%, a difference of 0.080%), and Cajun (13.4%, a difference of 0.14%).
| Demographics | Rating | Rank | Divorced or Separated |
| Americans | 0.0 /100 | #309 | Tragic 13.2% |
| Africans | 0.0 /100 | #310 | Tragic 13.2% |
| Sioux | 0.0 /100 | #311 | Tragic 13.2% |
| Blackfeet | 0.0 /100 | #312 | Tragic 13.3% |
| Immigrants | Nicaragua | 0.0 /100 | #313 | Tragic 13.3% |
| Yaqui | 0.0 /100 | #314 | Tragic 13.3% |
| Spanish Americans | 0.0 /100 | #315 | Tragic 13.3% |
| Tsimshian | 0.0 /100 | #316 | Tragic 13.3% |
| Haitians | 0.0 /100 | #317 | Tragic 13.3% |
| Cree | 0.0 /100 | #318 | Tragic 13.4% |
| Puget Sound Salish | 0.0 /100 | #319 | Tragic 13.4% |
| Cajuns | 0.0 /100 | #320 | Tragic 13.4% |
| Cheyenne | 0.0 /100 | #321 | Tragic 13.4% |
| Immigrants | Haiti | 0.0 /100 | #322 | Tragic 13.4% |
| U.S. Virgin Islanders | 0.0 /100 | #323 | Tragic 13.4% |