Immigrants from North America vs Immigrants from Micronesia Currently Married
COMPARE
Immigrants from North America
Immigrants from Micronesia
Currently Married
Currently Married Comparison
Immigrants from North America
Immigrants from Micronesia
48.7%
CURRENTLY MARRIED
99.3/ 100
METRIC RATING
44th/ 347
METRIC RANK
45.6%
CURRENTLY MARRIED
8.8/ 100
METRIC RATING
209th/ 347
METRIC RANK
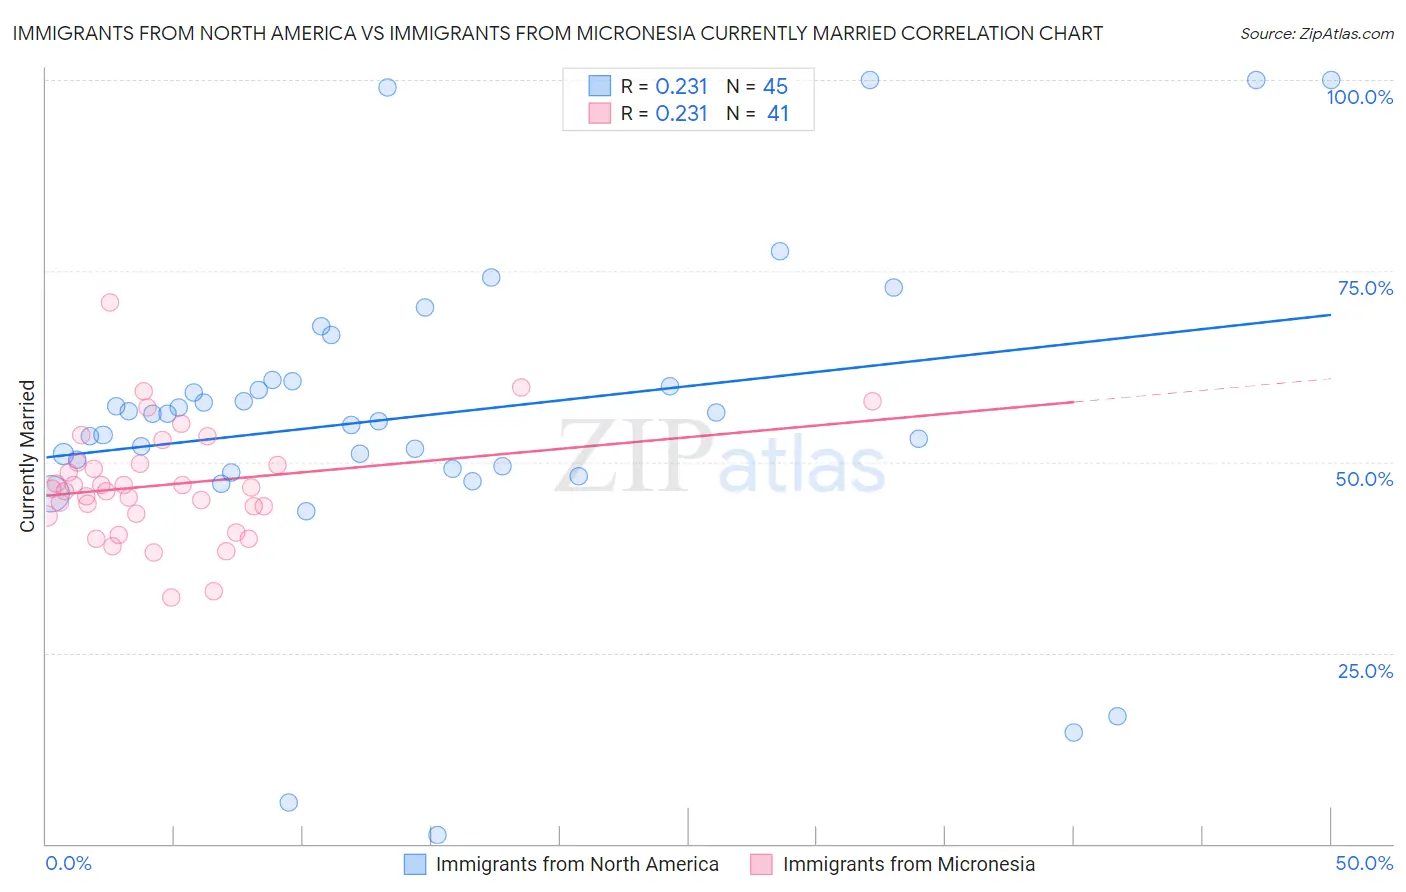
Immigrants from North America vs Immigrants from Micronesia Currently Married Correlation Chart
The statistical analysis conducted on geographies consisting of 462,399,389 people shows a weak positive correlation between the proportion of Immigrants from North America and percentage of population currently married in the United States with a correlation coefficient (R) of 0.231 and weighted average of 48.7%. Similarly, the statistical analysis conducted on geographies consisting of 61,606,735 people shows a weak positive correlation between the proportion of Immigrants from Micronesia and percentage of population currently married in the United States with a correlation coefficient (R) of 0.231 and weighted average of 45.6%, a difference of 6.8%.
Currently Married Correlation Summary
| Measurement | Immigrants from North America | Immigrants from Micronesia |
| Minimum | 1.1% | 32.3% |
| Maximum | 100.0% | 70.8% |
| Range | 98.9% | 38.5% |
| Mean | 56.2% | 47.1% |
| Median | 56.2% | 46.5% |
| Interquartile 25% (IQ1) | 49.3% | 43.1% |
| Interquartile 75% (IQ3) | 60.6% | 49.9% |
| Interquartile Range (IQR) | 11.4% | 6.8% |
| Standard Deviation (Sample) | 20.7% | 7.4% |
| Standard Deviation (Population) | 20.5% | 7.3% |
Similar Demographics by Currently Married
Demographics Similar to Immigrants from North America by Currently Married
In terms of currently married, the demographic groups most similar to Immigrants from North America are Scotch-Irish (48.7%, a difference of 0.030%), Belgian (48.7%, a difference of 0.030%), Finnish (48.8%, a difference of 0.040%), Immigrants from Iran (48.7%, a difference of 0.060%), and Northern European (48.7%, a difference of 0.060%).
| Demographics | Rating | Rank | Currently Married |
| Hungarians | 99.4 /100 | #37 | Exceptional 48.8% |
| Czechoslovakians | 99.4 /100 | #38 | Exceptional 48.8% |
| British | 99.4 /100 | #39 | Exceptional 48.8% |
| Immigrants | Canada | 99.4 /100 | #40 | Exceptional 48.8% |
| Greeks | 99.3 /100 | #41 | Exceptional 48.8% |
| Finns | 99.3 /100 | #42 | Exceptional 48.8% |
| Scotch-Irish | 99.3 /100 | #43 | Exceptional 48.7% |
| Immigrants | North America | 99.3 /100 | #44 | Exceptional 48.7% |
| Belgians | 99.3 /100 | #45 | Exceptional 48.7% |
| Immigrants | Iran | 99.2 /100 | #46 | Exceptional 48.7% |
| Northern Europeans | 99.2 /100 | #47 | Exceptional 48.7% |
| Austrians | 99.2 /100 | #48 | Exceptional 48.7% |
| Bhutanese | 99.1 /100 | #49 | Exceptional 48.6% |
| Iranians | 99.0 /100 | #50 | Exceptional 48.6% |
| Whites/Caucasians | 99.0 /100 | #51 | Exceptional 48.6% |
Demographics Similar to Immigrants from Micronesia by Currently Married
In terms of currently married, the demographic groups most similar to Immigrants from Micronesia are Uruguayan (45.6%, a difference of 0.11%), Houma (45.5%, a difference of 0.20%), Marshallese (45.5%, a difference of 0.20%), Alsatian (45.7%, a difference of 0.21%), and Immigrants from South America (45.7%, a difference of 0.22%).
| Demographics | Rating | Rank | Currently Married |
| Immigrants | Albania | 14.5 /100 | #202 | Poor 45.9% |
| Taiwanese | 11.7 /100 | #203 | Poor 45.8% |
| Immigrants | Spain | 11.6 /100 | #204 | Poor 45.8% |
| South American Indians | 11.5 /100 | #205 | Poor 45.8% |
| Immigrants | Immigrants | 11.2 /100 | #206 | Poor 45.8% |
| Immigrants | South America | 10.8 /100 | #207 | Poor 45.7% |
| Alsatians | 10.8 /100 | #208 | Poor 45.7% |
| Immigrants | Micronesia | 8.8 /100 | #209 | Tragic 45.6% |
| Uruguayans | 7.9 /100 | #210 | Tragic 45.6% |
| Houma | 7.2 /100 | #211 | Tragic 45.5% |
| Marshallese | 7.2 /100 | #212 | Tragic 45.5% |
| Alaska Natives | 7.0 /100 | #213 | Tragic 45.5% |
| Dutch West Indians | 6.7 /100 | #214 | Tragic 45.5% |
| German Russians | 6.7 /100 | #215 | Tragic 45.5% |
| Immigrants | Morocco | 5.5 /100 | #216 | Tragic 45.4% |