Cheyenne vs Immigrants from Micronesia Currently Married
COMPARE
Cheyenne
Immigrants from Micronesia
Currently Married
Currently Married Comparison
Cheyenne
Immigrants from Micronesia
42.2%
CURRENTLY MARRIED
0.0/ 100
METRIC RATING
297th/ 347
METRIC RANK
45.6%
CURRENTLY MARRIED
8.8/ 100
METRIC RATING
209th/ 347
METRIC RANK
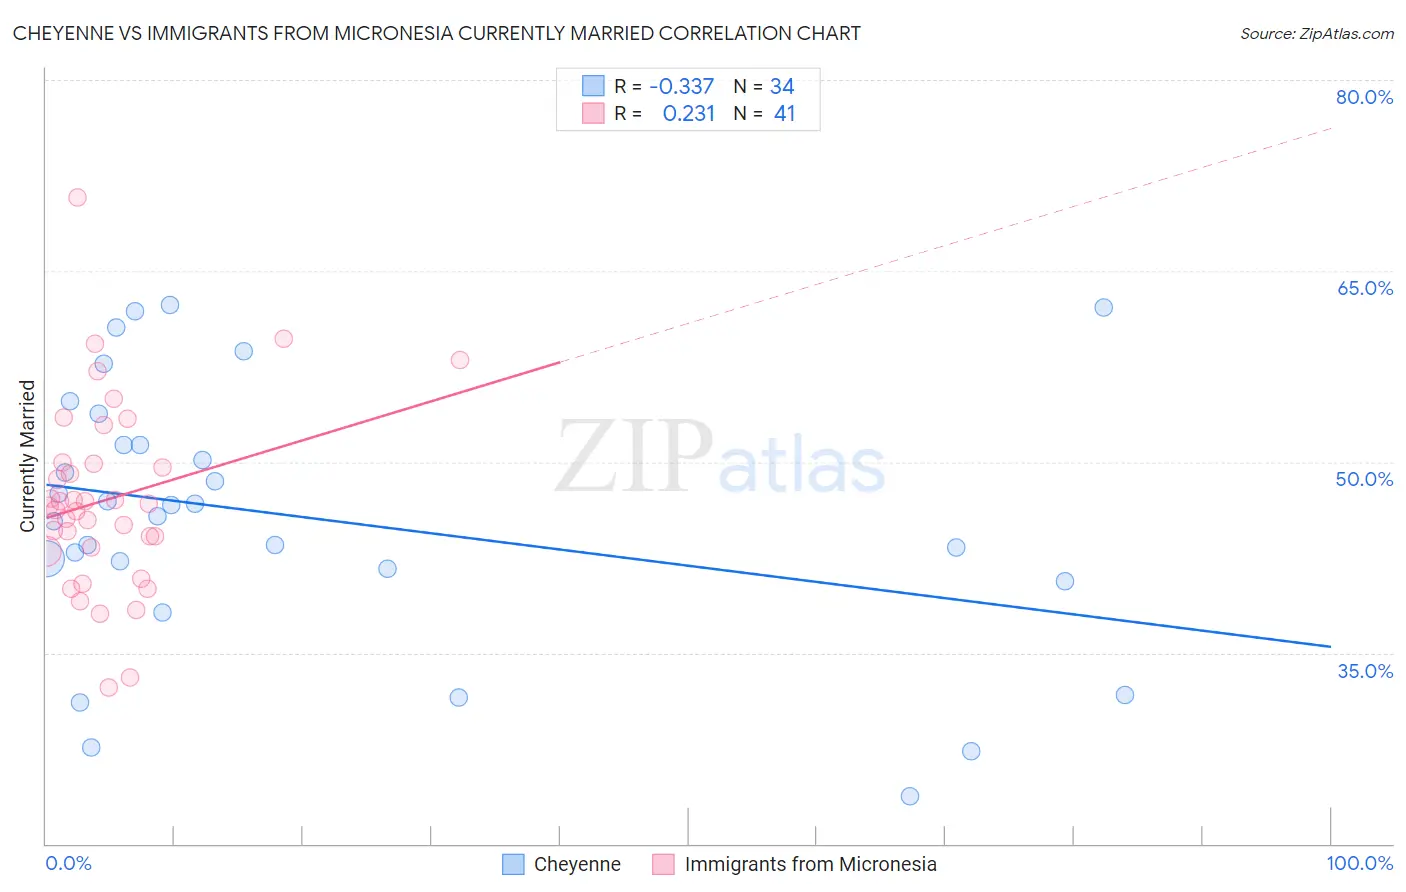
Cheyenne vs Immigrants from Micronesia Currently Married Correlation Chart
The statistical analysis conducted on geographies consisting of 80,721,070 people shows a mild negative correlation between the proportion of Cheyenne and percentage of population currently married in the United States with a correlation coefficient (R) of -0.337 and weighted average of 42.2%. Similarly, the statistical analysis conducted on geographies consisting of 61,606,735 people shows a weak positive correlation between the proportion of Immigrants from Micronesia and percentage of population currently married in the United States with a correlation coefficient (R) of 0.231 and weighted average of 45.6%, a difference of 8.0%.
Currently Married Correlation Summary
| Measurement | Cheyenne | Immigrants from Micronesia |
| Minimum | 23.7% | 32.3% |
| Maximum | 62.3% | 70.8% |
| Range | 38.6% | 38.5% |
| Mean | 45.6% | 47.1% |
| Median | 46.1% | 46.5% |
| Interquartile 25% (IQ1) | 41.6% | 43.1% |
| Interquartile 75% (IQ3) | 51.4% | 49.9% |
| Interquartile Range (IQR) | 9.8% | 6.8% |
| Standard Deviation (Sample) | 10.3% | 7.4% |
| Standard Deviation (Population) | 10.2% | 7.3% |
Similar Demographics by Currently Married
Demographics Similar to Cheyenne by Currently Married
In terms of currently married, the demographic groups most similar to Cheyenne are Immigrants from Honduras (42.2%, a difference of 0.090%), Menominee (42.3%, a difference of 0.11%), Liberian (42.2%, a difference of 0.12%), Belizean (42.2%, a difference of 0.22%), and Immigrants from Western Africa (42.4%, a difference of 0.31%).
| Demographics | Rating | Rank | Currently Married |
| Immigrants | Ghana | 0.0 /100 | #290 | Tragic 42.7% |
| Immigrants | Guatemala | 0.0 /100 | #291 | Tragic 42.6% |
| Sub-Saharan Africans | 0.0 /100 | #292 | Tragic 42.6% |
| Yuman | 0.0 /100 | #293 | Tragic 42.6% |
| Hondurans | 0.0 /100 | #294 | Tragic 42.5% |
| Immigrants | Western Africa | 0.0 /100 | #295 | Tragic 42.4% |
| Menominee | 0.0 /100 | #296 | Tragic 42.3% |
| Cheyenne | 0.0 /100 | #297 | Tragic 42.2% |
| Immigrants | Honduras | 0.0 /100 | #298 | Tragic 42.2% |
| Liberians | 0.0 /100 | #299 | Tragic 42.2% |
| Belizeans | 0.0 /100 | #300 | Tragic 42.2% |
| Immigrants | Yemen | 0.0 /100 | #301 | Tragic 42.1% |
| Immigrants | Zaire | 0.0 /100 | #302 | Tragic 42.0% |
| Sioux | 0.0 /100 | #303 | Tragic 41.9% |
| Immigrants | Bahamas | 0.0 /100 | #304 | Tragic 41.9% |
Demographics Similar to Immigrants from Micronesia by Currently Married
In terms of currently married, the demographic groups most similar to Immigrants from Micronesia are Uruguayan (45.6%, a difference of 0.11%), Houma (45.5%, a difference of 0.20%), Marshallese (45.5%, a difference of 0.20%), Alsatian (45.7%, a difference of 0.21%), and Immigrants from South America (45.7%, a difference of 0.22%).
| Demographics | Rating | Rank | Currently Married |
| Immigrants | Albania | 14.5 /100 | #202 | Poor 45.9% |
| Taiwanese | 11.7 /100 | #203 | Poor 45.8% |
| Immigrants | Spain | 11.6 /100 | #204 | Poor 45.8% |
| South American Indians | 11.5 /100 | #205 | Poor 45.8% |
| Immigrants | Immigrants | 11.2 /100 | #206 | Poor 45.8% |
| Immigrants | South America | 10.8 /100 | #207 | Poor 45.7% |
| Alsatians | 10.8 /100 | #208 | Poor 45.7% |
| Immigrants | Micronesia | 8.8 /100 | #209 | Tragic 45.6% |
| Uruguayans | 7.9 /100 | #210 | Tragic 45.6% |
| Houma | 7.2 /100 | #211 | Tragic 45.5% |
| Marshallese | 7.2 /100 | #212 | Tragic 45.5% |
| Alaska Natives | 7.0 /100 | #213 | Tragic 45.5% |
| Dutch West Indians | 6.7 /100 | #214 | Tragic 45.5% |
| German Russians | 6.7 /100 | #215 | Tragic 45.5% |
| Immigrants | Morocco | 5.5 /100 | #216 | Tragic 45.4% |