Cheyenne vs Immigrants from Hong Kong Married-couple Households
COMPARE
Cheyenne
Immigrants from Hong Kong
Married-couple Households
Married-couple Households Comparison
Cheyenne
Immigrants from Hong Kong
42.3%
MARRIED-COUPLE HOUSEHOLDS
0.0/ 100
METRIC RATING
284th/ 347
METRIC RANK
49.6%
MARRIED-COUPLE HOUSEHOLDS
99.9/ 100
METRIC RATING
17th/ 347
METRIC RANK
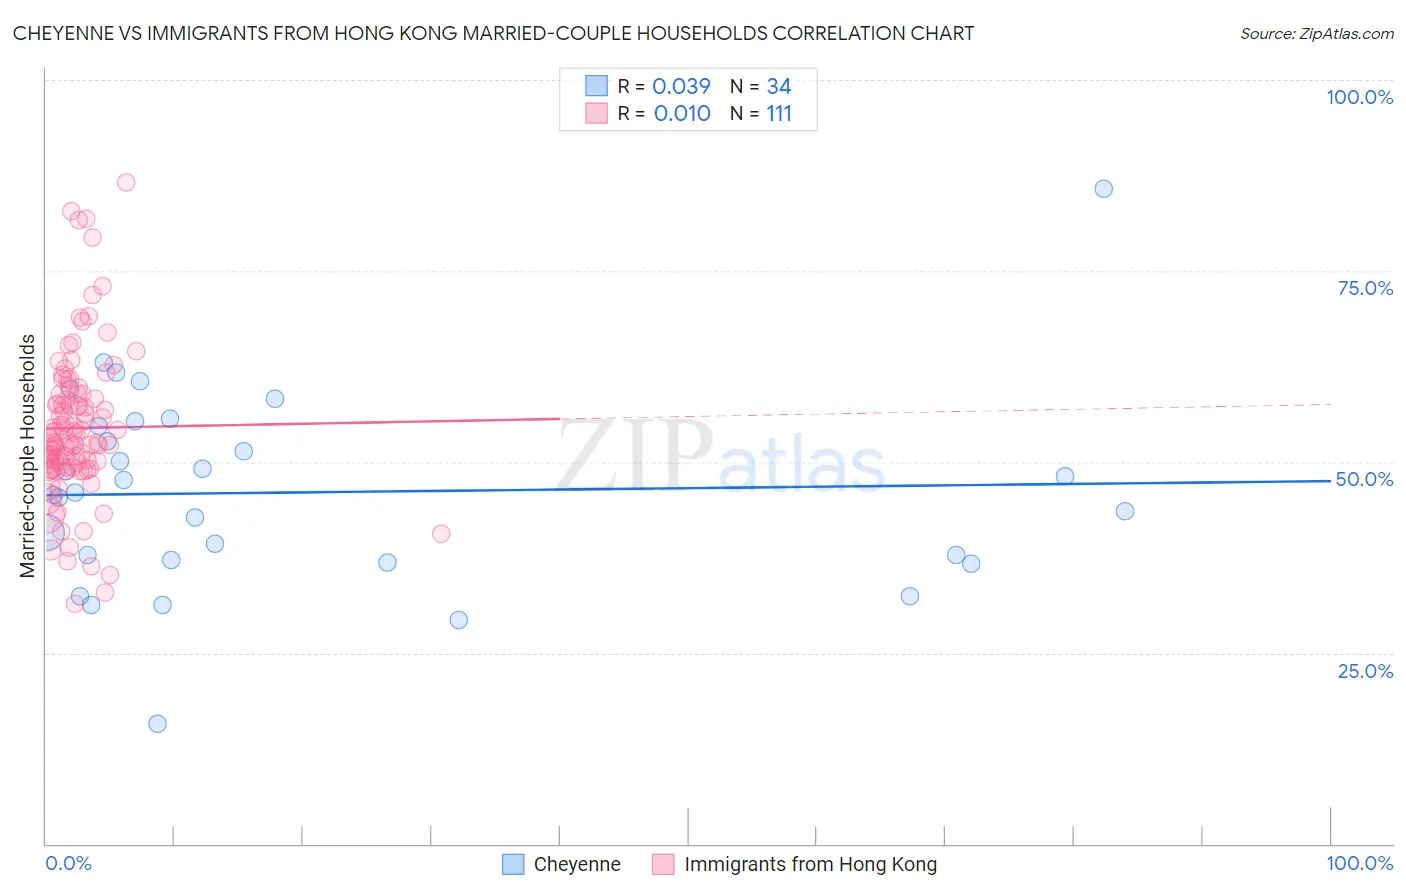
Cheyenne vs Immigrants from Hong Kong Married-couple Households Correlation Chart
The statistical analysis conducted on geographies consisting of 80,704,994 people shows no correlation between the proportion of Cheyenne and percentage of married-couple family households in the United States with a correlation coefficient (R) of 0.039 and weighted average of 42.3%. Similarly, the statistical analysis conducted on geographies consisting of 253,895,593 people shows no correlation between the proportion of Immigrants from Hong Kong and percentage of married-couple family households in the United States with a correlation coefficient (R) of 0.010 and weighted average of 49.6%, a difference of 17.5%.
Married-couple Households Correlation Summary
| Measurement | Cheyenne | Immigrants from Hong Kong |
| Minimum | 15.8% | 31.4% |
| Maximum | 85.7% | 86.6% |
| Range | 69.9% | 55.2% |
| Mean | 46.0% | 54.4% |
| Median | 45.8% | 52.5% |
| Interquartile 25% (IQ1) | 37.1% | 49.3% |
| Interquartile 75% (IQ3) | 54.6% | 58.8% |
| Interquartile Range (IQR) | 17.5% | 9.5% |
| Standard Deviation (Sample) | 12.9% | 9.9% |
| Standard Deviation (Population) | 12.7% | 9.9% |
Similar Demographics by Married-couple Households
Demographics Similar to Cheyenne by Married-couple Households
In terms of married-couple households, the demographic groups most similar to Cheyenne are Ghanaian (42.2%, a difference of 0.030%), Belizean (42.2%, a difference of 0.040%), Chippewa (42.1%, a difference of 0.27%), Immigrants from Eritrea (42.1%, a difference of 0.35%), and Inupiat (42.4%, a difference of 0.36%).
| Demographics | Rating | Rank | Married-couple Households |
| Immigrants | Eastern Africa | 0.0 /100 | #277 | Tragic 42.9% |
| Immigrants | Africa | 0.0 /100 | #278 | Tragic 42.9% |
| Sierra Leoneans | 0.0 /100 | #279 | Tragic 42.9% |
| Immigrants | Ecuador | 0.0 /100 | #280 | Tragic 42.9% |
| Immigrants | Guatemala | 0.0 /100 | #281 | Tragic 42.8% |
| Bermudans | 0.0 /100 | #282 | Tragic 42.4% |
| Inupiat | 0.0 /100 | #283 | Tragic 42.4% |
| Cheyenne | 0.0 /100 | #284 | Tragic 42.3% |
| Ghanaians | 0.0 /100 | #285 | Tragic 42.2% |
| Belizeans | 0.0 /100 | #286 | Tragic 42.2% |
| Chippewa | 0.0 /100 | #287 | Tragic 42.1% |
| Immigrants | Eritrea | 0.0 /100 | #288 | Tragic 42.1% |
| Sudanese | 0.0 /100 | #289 | Tragic 42.1% |
| Hondurans | 0.0 /100 | #290 | Tragic 42.1% |
| Paiute | 0.0 /100 | #291 | Tragic 42.1% |
Demographics Similar to Immigrants from Hong Kong by Married-couple Households
In terms of married-couple households, the demographic groups most similar to Immigrants from Hong Kong are English (49.6%, a difference of 0.010%), Swedish (49.7%, a difference of 0.15%), European (49.6%, a difference of 0.17%), Scandinavian (49.6%, a difference of 0.17%), and Korean (49.7%, a difference of 0.18%).
| Demographics | Rating | Rank | Married-couple Households |
| Chinese | 100.0 /100 | #10 | Exceptional 50.4% |
| Immigrants | Pakistan | 100.0 /100 | #11 | Exceptional 50.1% |
| Swiss | 100.0 /100 | #12 | Exceptional 49.9% |
| Immigrants | Korea | 100.0 /100 | #13 | Exceptional 49.9% |
| Burmese | 100.0 /100 | #14 | Exceptional 49.8% |
| Koreans | 99.9 /100 | #15 | Exceptional 49.7% |
| Swedes | 99.9 /100 | #16 | Exceptional 49.7% |
| Immigrants | Hong Kong | 99.9 /100 | #17 | Exceptional 49.6% |
| English | 99.9 /100 | #18 | Exceptional 49.6% |
| Europeans | 99.9 /100 | #19 | Exceptional 49.6% |
| Scandinavians | 99.9 /100 | #20 | Exceptional 49.6% |
| Norwegians | 99.9 /100 | #21 | Exceptional 49.5% |
| Asians | 99.9 /100 | #22 | Exceptional 49.5% |
| Dutch | 99.9 /100 | #23 | Exceptional 49.5% |
| Czechs | 99.9 /100 | #24 | Exceptional 49.4% |