Ethiopian vs Immigrants from Hong Kong High School Diploma
COMPARE
Ethiopian
Immigrants from Hong Kong
High School Diploma
High School Diploma Comparison
Ethiopians
Immigrants from Hong Kong
89.0%
HIGH SCHOOL DIPLOMA
37.0/ 100
METRIC RATING
185th/ 347
METRIC RANK
89.3%
HIGH SCHOOL DIPLOMA
58.6/ 100
METRIC RATING
167th/ 347
METRIC RANK
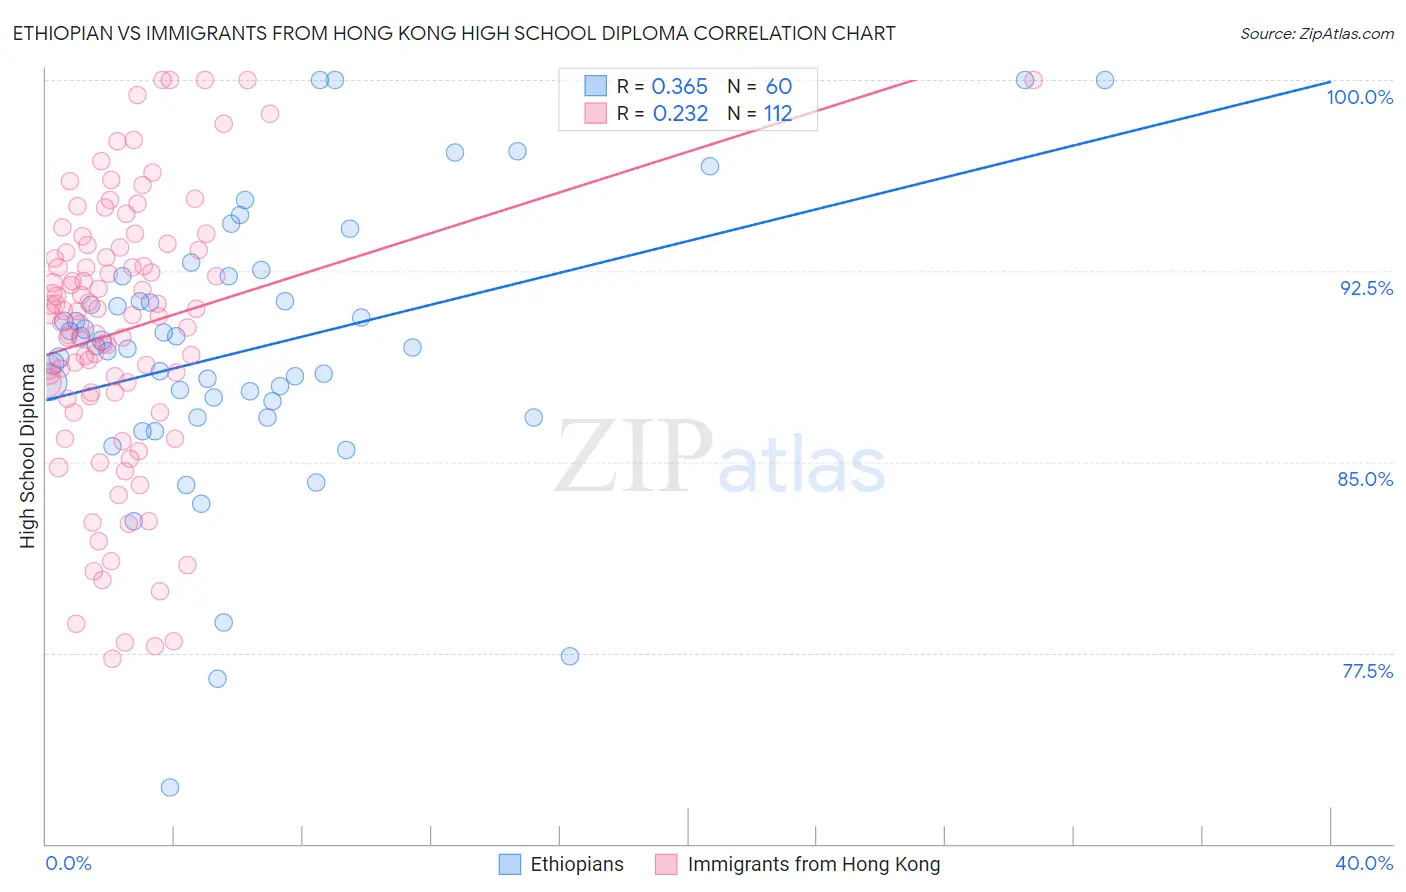
Ethiopian vs Immigrants from Hong Kong High School Diploma Correlation Chart
The statistical analysis conducted on geographies consisting of 223,235,367 people shows a mild positive correlation between the proportion of Ethiopians and percentage of population with at least high school diploma education in the United States with a correlation coefficient (R) of 0.365 and weighted average of 89.0%. Similarly, the statistical analysis conducted on geographies consisting of 253,990,250 people shows a weak positive correlation between the proportion of Immigrants from Hong Kong and percentage of population with at least high school diploma education in the United States with a correlation coefficient (R) of 0.232 and weighted average of 89.3%, a difference of 0.33%.
High School Diploma Correlation Summary
| Measurement | Ethiopian | Immigrants from Hong Kong |
| Minimum | 72.2% | 77.3% |
| Maximum | 100.0% | 100.0% |
| Range | 27.8% | 22.7% |
| Mean | 89.4% | 90.2% |
| Median | 89.5% | 90.9% |
| Interquartile 25% (IQ1) | 87.1% | 87.7% |
| Interquartile 75% (IQ3) | 91.8% | 93.4% |
| Interquartile Range (IQR) | 4.7% | 5.7% |
| Standard Deviation (Sample) | 5.4% | 5.3% |
| Standard Deviation (Population) | 5.4% | 5.3% |
Demographics Similar to Ethiopians and Immigrants from Hong Kong by High School Diploma
In terms of high school diploma, the demographic groups most similar to Ethiopians are Immigrants from Eastern Africa (88.9%, a difference of 0.020%), Immigrants from Syria (89.0%, a difference of 0.040%), Potawatomi (89.0%, a difference of 0.090%), Venezuelan (89.1%, a difference of 0.10%), and Spaniard (89.1%, a difference of 0.10%). Similarly, the demographic groups most similar to Immigrants from Hong Kong are Immigrants from Albania (89.3%, a difference of 0.010%), Delaware (89.2%, a difference of 0.040%), Iroquois (89.2%, a difference of 0.050%), Immigrants from Morocco (89.2%, a difference of 0.080%), and Spanish (89.2%, a difference of 0.090%).
| Demographics | Rating | Rank | High School Diploma |
| Immigrants | Albania | 59.4 /100 | #166 | Average 89.3% |
| Immigrants | Hong Kong | 58.6 /100 | #167 | Average 89.3% |
| Delaware | 55.8 /100 | #168 | Average 89.2% |
| Iroquois | 55.1 /100 | #169 | Average 89.2% |
| Immigrants | Morocco | 53.3 /100 | #170 | Average 89.2% |
| Spanish | 52.9 /100 | #171 | Average 89.2% |
| Immigrants | Nonimmigrants | 51.8 /100 | #172 | Average 89.2% |
| Immigrants | Indonesia | 50.3 /100 | #173 | Average 89.1% |
| Hmong | 50.0 /100 | #174 | Average 89.1% |
| Immigrants | Western Asia | 49.0 /100 | #175 | Average 89.1% |
| Osage | 48.9 /100 | #176 | Average 89.1% |
| Sudanese | 48.5 /100 | #177 | Average 89.1% |
| Sierra Leoneans | 48.4 /100 | #178 | Average 89.1% |
| Americans | 47.2 /100 | #179 | Average 89.1% |
| Bolivians | 45.2 /100 | #180 | Average 89.1% |
| Venezuelans | 43.6 /100 | #181 | Average 89.1% |
| Spaniards | 43.4 /100 | #182 | Average 89.1% |
| Potawatomi | 42.5 /100 | #183 | Average 89.0% |
| Immigrants | Syria | 39.2 /100 | #184 | Fair 89.0% |
| Ethiopians | 37.0 /100 | #185 | Fair 89.0% |
| Immigrants | Eastern Africa | 35.8 /100 | #186 | Fair 88.9% |