Immigrants from Liberia vs Immigrants from Hong Kong Married-couple Households
COMPARE
Immigrants from Liberia
Immigrants from Hong Kong
Married-couple Households
Married-couple Households Comparison
Immigrants from Liberia
Immigrants from Hong Kong
40.3%
MARRIED-COUPLE HOUSEHOLDS
0.0/ 100
METRIC RATING
321st/ 347
METRIC RANK
49.6%
MARRIED-COUPLE HOUSEHOLDS
99.9/ 100
METRIC RATING
17th/ 347
METRIC RANK
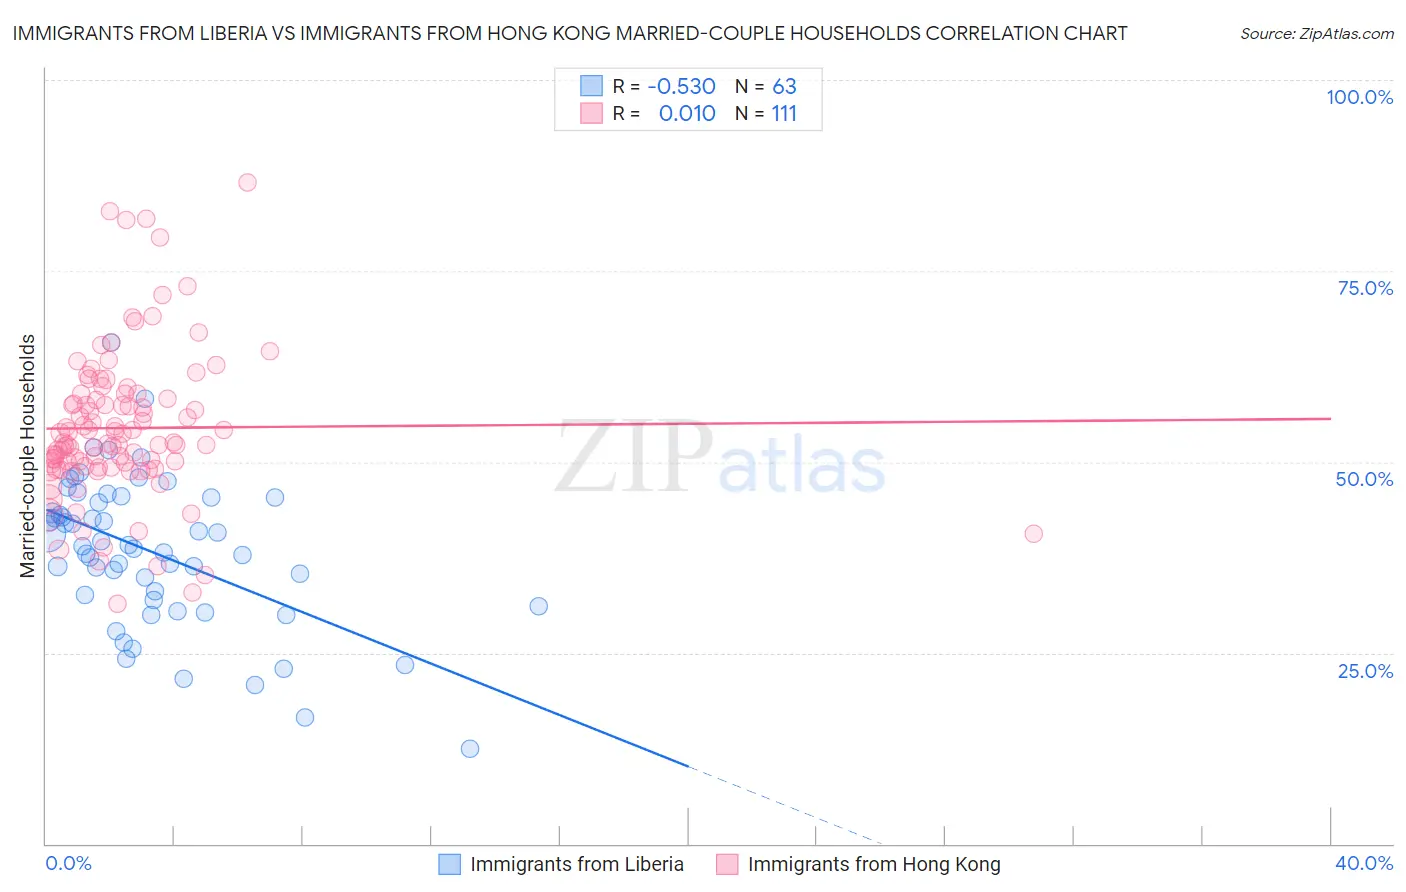
Immigrants from Liberia vs Immigrants from Hong Kong Married-couple Households Correlation Chart
The statistical analysis conducted on geographies consisting of 135,232,319 people shows a substantial negative correlation between the proportion of Immigrants from Liberia and percentage of married-couple family households in the United States with a correlation coefficient (R) of -0.530 and weighted average of 40.3%. Similarly, the statistical analysis conducted on geographies consisting of 253,895,593 people shows no correlation between the proportion of Immigrants from Hong Kong and percentage of married-couple family households in the United States with a correlation coefficient (R) of 0.010 and weighted average of 49.6%, a difference of 23.1%.
Married-couple Households Correlation Summary
| Measurement | Immigrants from Liberia | Immigrants from Hong Kong |
| Minimum | 12.5% | 31.4% |
| Maximum | 65.7% | 86.6% |
| Range | 53.2% | 55.2% |
| Mean | 38.2% | 54.4% |
| Median | 39.0% | 52.5% |
| Interquartile 25% (IQ1) | 32.0% | 49.3% |
| Interquartile 75% (IQ3) | 45.3% | 58.8% |
| Interquartile Range (IQR) | 13.3% | 9.5% |
| Standard Deviation (Sample) | 9.8% | 9.9% |
| Standard Deviation (Population) | 9.7% | 9.9% |
Similar Demographics by Married-couple Households
Demographics Similar to Immigrants from Liberia by Married-couple Households
In terms of married-couple households, the demographic groups most similar to Immigrants from Liberia are West Indian (40.3%, a difference of 0.040%), Bahamian (40.5%, a difference of 0.45%), Immigrants from Zaire (40.1%, a difference of 0.66%), Puerto Rican (40.1%, a difference of 0.66%), and Navajo (40.1%, a difference of 0.67%).
| Demographics | Rating | Rank | Married-couple Households |
| Jamaicans | 0.0 /100 | #314 | Tragic 40.9% |
| Trinidadians and Tobagonians | 0.0 /100 | #315 | Tragic 40.9% |
| Immigrants | Caribbean | 0.0 /100 | #316 | Tragic 40.8% |
| Immigrants | Jamaica | 0.0 /100 | #317 | Tragic 40.7% |
| Liberians | 0.0 /100 | #318 | Tragic 40.7% |
| Bahamians | 0.0 /100 | #319 | Tragic 40.5% |
| West Indians | 0.0 /100 | #320 | Tragic 40.3% |
| Immigrants | Liberia | 0.0 /100 | #321 | Tragic 40.3% |
| Immigrants | Zaire | 0.0 /100 | #322 | Tragic 40.1% |
| Puerto Ricans | 0.0 /100 | #323 | Tragic 40.1% |
| Navajo | 0.0 /100 | #324 | Tragic 40.1% |
| Pueblo | 0.0 /100 | #325 | Tragic 40.0% |
| U.S. Virgin Islanders | 0.0 /100 | #326 | Tragic 39.8% |
| Lumbee | 0.0 /100 | #327 | Tragic 39.6% |
| Barbadians | 0.0 /100 | #328 | Tragic 39.4% |
Demographics Similar to Immigrants from Hong Kong by Married-couple Households
In terms of married-couple households, the demographic groups most similar to Immigrants from Hong Kong are English (49.6%, a difference of 0.010%), Swedish (49.7%, a difference of 0.15%), European (49.6%, a difference of 0.17%), Scandinavian (49.6%, a difference of 0.17%), and Korean (49.7%, a difference of 0.18%).
| Demographics | Rating | Rank | Married-couple Households |
| Chinese | 100.0 /100 | #10 | Exceptional 50.4% |
| Immigrants | Pakistan | 100.0 /100 | #11 | Exceptional 50.1% |
| Swiss | 100.0 /100 | #12 | Exceptional 49.9% |
| Immigrants | Korea | 100.0 /100 | #13 | Exceptional 49.9% |
| Burmese | 100.0 /100 | #14 | Exceptional 49.8% |
| Koreans | 99.9 /100 | #15 | Exceptional 49.7% |
| Swedes | 99.9 /100 | #16 | Exceptional 49.7% |
| Immigrants | Hong Kong | 99.9 /100 | #17 | Exceptional 49.6% |
| English | 99.9 /100 | #18 | Exceptional 49.6% |
| Europeans | 99.9 /100 | #19 | Exceptional 49.6% |
| Scandinavians | 99.9 /100 | #20 | Exceptional 49.6% |
| Norwegians | 99.9 /100 | #21 | Exceptional 49.5% |
| Asians | 99.9 /100 | #22 | Exceptional 49.5% |
| Dutch | 99.9 /100 | #23 | Exceptional 49.5% |
| Czechs | 99.9 /100 | #24 | Exceptional 49.4% |