Afghan vs Immigrants from Australia Married-couple Households
COMPARE
Afghan
Immigrants from Australia
Married-couple Households
Married-couple Households Comparison
Afghans
Immigrants from Australia
48.0%
MARRIED-COUPLE HOUSEHOLDS
97.3/ 100
METRIC RATING
88th/ 347
METRIC RANK
46.5%
MARRIED-COUPLE HOUSEHOLDS
54.6/ 100
METRIC RATING
172nd/ 347
METRIC RANK
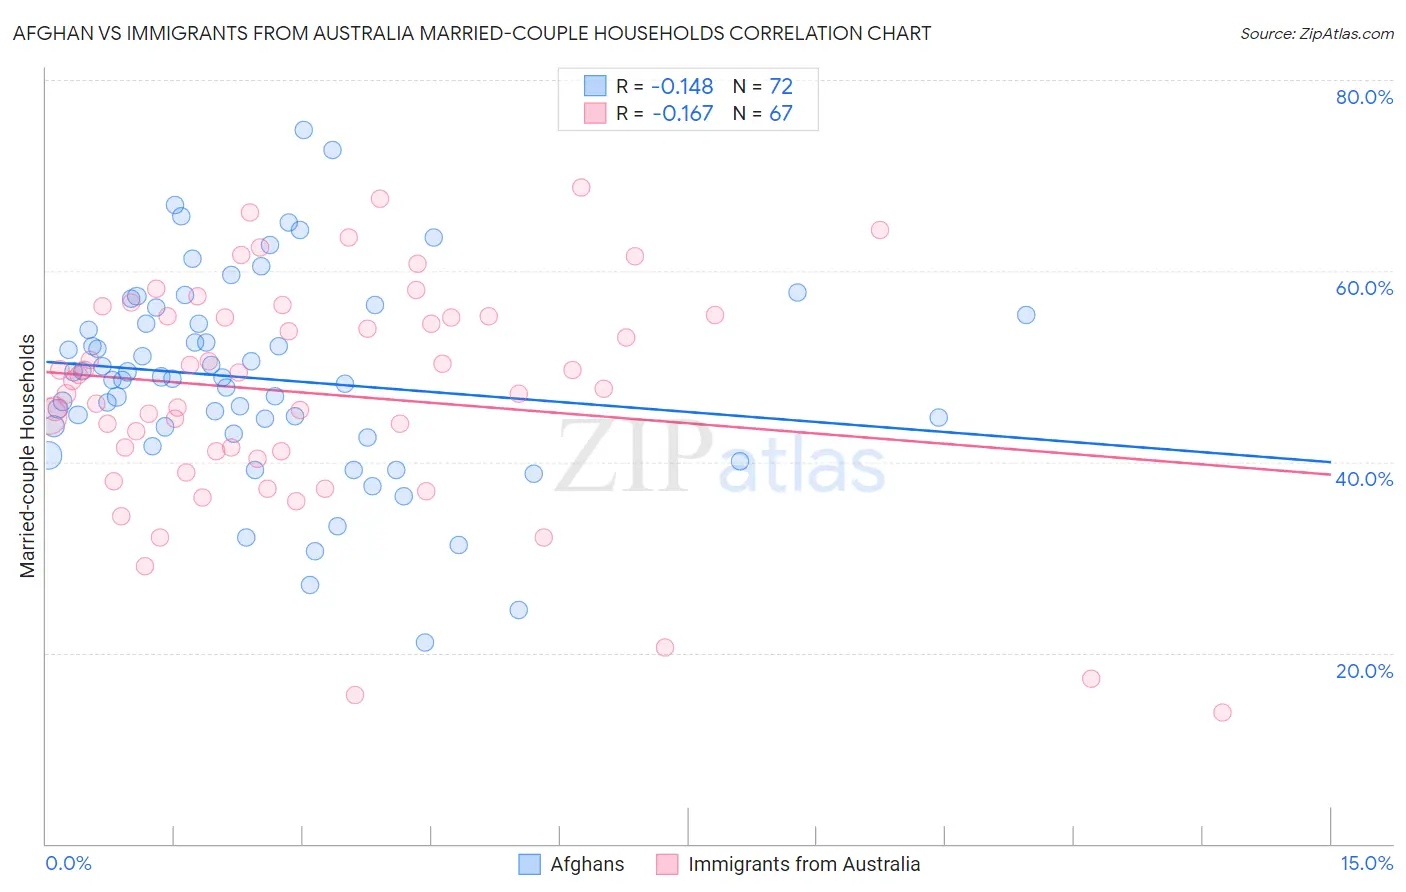
Afghan vs Immigrants from Australia Married-couple Households Correlation Chart
The statistical analysis conducted on geographies consisting of 148,828,994 people shows a poor negative correlation between the proportion of Afghans and percentage of married-couple family households in the United States with a correlation coefficient (R) of -0.148 and weighted average of 48.0%. Similarly, the statistical analysis conducted on geographies consisting of 227,144,828 people shows a poor negative correlation between the proportion of Immigrants from Australia and percentage of married-couple family households in the United States with a correlation coefficient (R) of -0.167 and weighted average of 46.5%, a difference of 3.2%.
Married-couple Households Correlation Summary
| Measurement | Afghan | Immigrants from Australia |
| Minimum | 21.1% | 13.7% |
| Maximum | 74.7% | 68.8% |
| Range | 53.6% | 55.0% |
| Mean | 48.7% | 47.2% |
| Median | 48.8% | 48.5% |
| Interquartile 25% (IQ1) | 43.3% | 41.1% |
| Interquartile 75% (IQ3) | 55.0% | 55.3% |
| Interquartile Range (IQR) | 11.7% | 14.1% |
| Standard Deviation (Sample) | 10.5% | 12.0% |
| Standard Deviation (Population) | 10.5% | 11.9% |
Similar Demographics by Married-couple Households
Demographics Similar to Afghans by Married-couple Households
In terms of married-couple households, the demographic groups most similar to Afghans are Immigrants from Ireland (48.0%, a difference of 0.0%), Belgian (48.0%, a difference of 0.020%), Cypriot (48.0%, a difference of 0.030%), Immigrants from Israel (48.0%, a difference of 0.040%), and French (48.0%, a difference of 0.040%).
| Demographics | Rating | Rank | Married-couple Households |
| Finns | 98.0 /100 | #81 | Exceptional 48.1% |
| Immigrants | Poland | 97.7 /100 | #82 | Exceptional 48.1% |
| Guamanians/Chamorros | 97.6 /100 | #83 | Exceptional 48.1% |
| Ukrainians | 97.6 /100 | #84 | Exceptional 48.1% |
| Immigrants | Israel | 97.4 /100 | #85 | Exceptional 48.0% |
| Belgians | 97.4 /100 | #86 | Exceptional 48.0% |
| Immigrants | Ireland | 97.3 /100 | #87 | Exceptional 48.0% |
| Afghans | 97.3 /100 | #88 | Exceptional 48.0% |
| Cypriots | 97.2 /100 | #89 | Exceptional 48.0% |
| French | 97.2 /100 | #90 | Exceptional 48.0% |
| Immigrants | Moldova | 97.0 /100 | #91 | Exceptional 48.0% |
| Palestinians | 96.9 /100 | #92 | Exceptional 48.0% |
| Lebanese | 96.9 /100 | #93 | Exceptional 47.9% |
| Americans | 96.9 /100 | #94 | Exceptional 47.9% |
| Immigrants | Belgium | 96.8 /100 | #95 | Exceptional 47.9% |
Demographics Similar to Immigrants from Australia by Married-couple Households
In terms of married-couple households, the demographic groups most similar to Immigrants from Australia are Immigrants from Chile (46.5%, a difference of 0.040%), Immigrants from Norway (46.5%, a difference of 0.10%), South American (46.6%, a difference of 0.13%), Immigrants from Mexico (46.4%, a difference of 0.17%), and Spanish American Indian (46.6%, a difference of 0.18%).
| Demographics | Rating | Rank | Married-couple Households |
| Immigrants | Southern Europe | 69.9 /100 | #165 | Good 46.8% |
| Cherokee | 65.7 /100 | #166 | Good 46.7% |
| Immigrants | Croatia | 64.2 /100 | #167 | Good 46.7% |
| Israelis | 62.3 /100 | #168 | Good 46.7% |
| Spanish American Indians | 59.4 /100 | #169 | Average 46.6% |
| South Americans | 58.0 /100 | #170 | Average 46.6% |
| Immigrants | Chile | 55.7 /100 | #171 | Average 46.5% |
| Immigrants | Australia | 54.6 /100 | #172 | Average 46.5% |
| Immigrants | Norway | 52.0 /100 | #173 | Average 46.5% |
| Immigrants | Mexico | 50.0 /100 | #174 | Average 46.4% |
| Immigrants | Colombia | 46.1 /100 | #175 | Average 46.4% |
| Cajuns | 45.2 /100 | #176 | Average 46.4% |
| Immigrants | Immigrants | 43.8 /100 | #177 | Average 46.3% |
| Immigrants | Costa Rica | 43.4 /100 | #178 | Average 46.3% |
| Immigrants | Zimbabwe | 43.0 /100 | #179 | Average 46.3% |