Armenian vs Immigrants from Australia Married-couple Households
COMPARE
Armenian
Immigrants from Australia
Married-couple Households
Married-couple Households Comparison
Armenians
Immigrants from Australia
46.9%
MARRIED-COUPLE HOUSEHOLDS
75.4/ 100
METRIC RATING
156th/ 347
METRIC RANK
46.5%
MARRIED-COUPLE HOUSEHOLDS
54.6/ 100
METRIC RATING
172nd/ 347
METRIC RANK
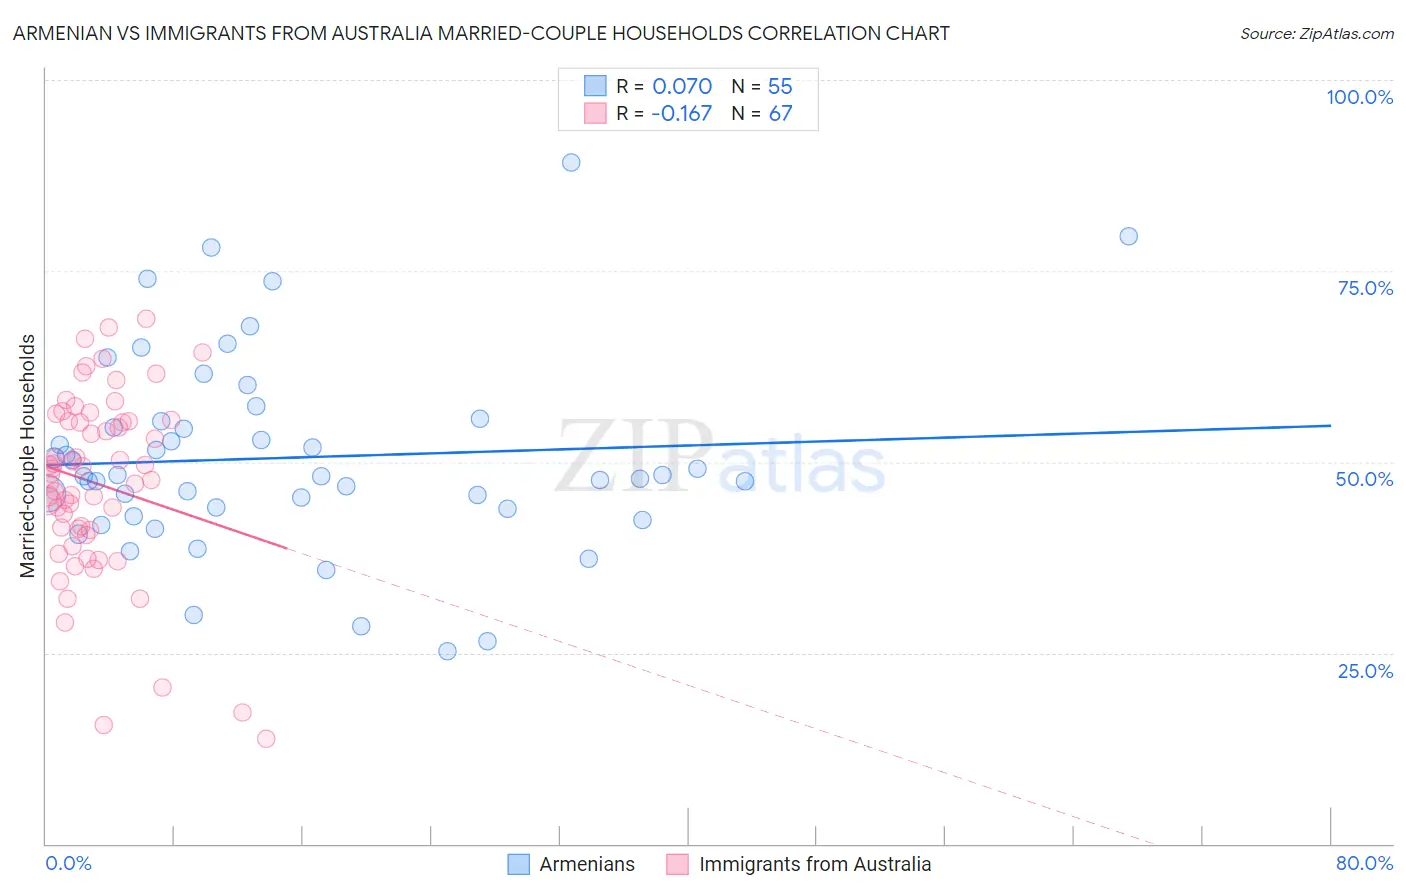
Armenian vs Immigrants from Australia Married-couple Households Correlation Chart
The statistical analysis conducted on geographies consisting of 310,765,570 people shows a slight positive correlation between the proportion of Armenians and percentage of married-couple family households in the United States with a correlation coefficient (R) of 0.070 and weighted average of 46.9%. Similarly, the statistical analysis conducted on geographies consisting of 227,144,828 people shows a poor negative correlation between the proportion of Immigrants from Australia and percentage of married-couple family households in the United States with a correlation coefficient (R) of -0.167 and weighted average of 46.5%, a difference of 0.88%.
Married-couple Households Correlation Summary
| Measurement | Armenian | Immigrants from Australia |
| Minimum | 25.2% | 13.7% |
| Maximum | 89.1% | 68.8% |
| Range | 63.9% | 55.0% |
| Mean | 50.5% | 47.2% |
| Median | 48.2% | 48.5% |
| Interquartile 25% (IQ1) | 43.8% | 41.1% |
| Interquartile 75% (IQ3) | 55.2% | 55.3% |
| Interquartile Range (IQR) | 11.4% | 14.1% |
| Standard Deviation (Sample) | 12.8% | 12.0% |
| Standard Deviation (Population) | 12.7% | 11.9% |
Demographics Similar to Armenians and Immigrants from Australia by Married-couple Households
In terms of married-couple households, the demographic groups most similar to Armenians are Arab (46.9%, a difference of 0.030%), Immigrants from Oceania (46.9%, a difference of 0.030%), Immigrants from Western Asia (46.9%, a difference of 0.040%), Nonimmigrants (46.9%, a difference of 0.10%), and Osage (46.9%, a difference of 0.10%). Similarly, the demographic groups most similar to Immigrants from Australia are Immigrants from Chile (46.5%, a difference of 0.040%), Immigrants from Norway (46.5%, a difference of 0.10%), South American (46.6%, a difference of 0.13%), Immigrants from Mexico (46.4%, a difference of 0.17%), and Spanish American Indian (46.6%, a difference of 0.18%).
| Demographics | Rating | Rank | Married-couple Households |
| Immigrants | Western Asia | 76.1 /100 | #154 | Good 46.9% |
| Arabs | 76.0 /100 | #155 | Good 46.9% |
| Armenians | 75.4 /100 | #156 | Good 46.9% |
| Immigrants | Oceania | 74.8 /100 | #157 | Good 46.9% |
| Immigrants | Nonimmigrants | 73.3 /100 | #158 | Good 46.9% |
| Osage | 73.2 /100 | #159 | Good 46.9% |
| Iraqis | 71.7 /100 | #160 | Good 46.9% |
| Delaware | 71.2 /100 | #161 | Good 46.8% |
| Colombians | 71.0 /100 | #162 | Good 46.8% |
| Immigrants | Turkey | 70.2 /100 | #163 | Good 46.8% |
| Immigrants | Kazakhstan | 70.0 /100 | #164 | Good 46.8% |
| Immigrants | Southern Europe | 69.9 /100 | #165 | Good 46.8% |
| Cherokee | 65.7 /100 | #166 | Good 46.7% |
| Immigrants | Croatia | 64.2 /100 | #167 | Good 46.7% |
| Israelis | 62.3 /100 | #168 | Good 46.7% |
| Spanish American Indians | 59.4 /100 | #169 | Average 46.6% |
| South Americans | 58.0 /100 | #170 | Average 46.6% |
| Immigrants | Chile | 55.7 /100 | #171 | Average 46.5% |
| Immigrants | Australia | 54.6 /100 | #172 | Average 46.5% |
| Immigrants | Norway | 52.0 /100 | #173 | Average 46.5% |
| Immigrants | Mexico | 50.0 /100 | #174 | Average 46.4% |