Puget Sound Salish vs Black/African American Currently Married
COMPARE
Puget Sound Salish
Black/African American
Currently Married
Currently Married Comparison
Puget Sound Salish
Blacks/African Americans
47.6%
CURRENTLY MARRIED
90.3/ 100
METRIC RATING
117th/ 347
METRIC RANK
39.6%
CURRENTLY MARRIED
0.0/ 100
METRIC RATING
337th/ 347
METRIC RANK
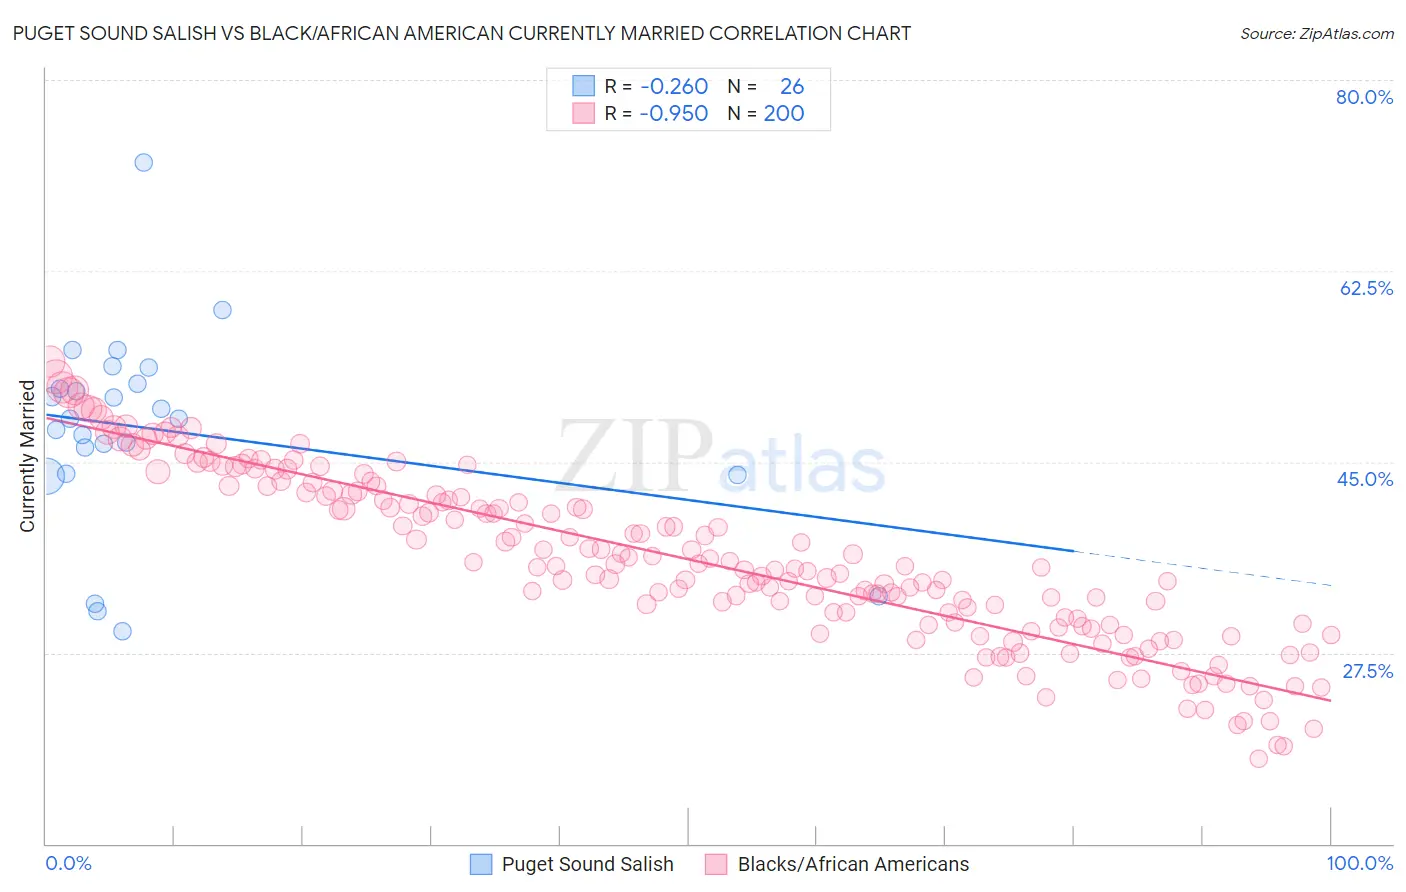
Puget Sound Salish vs Black/African American Currently Married Correlation Chart
The statistical analysis conducted on geographies consisting of 46,155,865 people shows a weak negative correlation between the proportion of Puget Sound Salish and percentage of population currently married in the United States with a correlation coefficient (R) of -0.260 and weighted average of 47.6%. Similarly, the statistical analysis conducted on geographies consisting of 565,898,128 people shows a near-perfect negative correlation between the proportion of Blacks/African Americans and percentage of population currently married in the United States with a correlation coefficient (R) of -0.950 and weighted average of 39.6%, a difference of 20.1%.
Currently Married Correlation Summary
| Measurement | Puget Sound Salish | Black/African American |
| Minimum | 29.5% | 17.8% |
| Maximum | 72.4% | 54.2% |
| Range | 42.9% | 36.4% |
| Mean | 47.9% | 36.1% |
| Median | 48.9% | 35.4% |
| Interquartile 25% (IQ1) | 43.9% | 30.1% |
| Interquartile 75% (IQ3) | 52.2% | 42.1% |
| Interquartile Range (IQR) | 8.3% | 12.0% |
| Standard Deviation (Sample) | 9.2% | 7.9% |
| Standard Deviation (Population) | 9.0% | 7.9% |
Similar Demographics by Currently Married
Demographics Similar to Puget Sound Salish by Currently Married
In terms of currently married, the demographic groups most similar to Puget Sound Salish are Immigrants from Philippines (47.6%, a difference of 0.010%), Australian (47.6%, a difference of 0.010%), Immigrants from Indonesia (47.6%, a difference of 0.020%), Palestinian (47.6%, a difference of 0.020%), and South African (47.6%, a difference of 0.030%).
| Demographics | Rating | Rank | Currently Married |
| Immigrants | Russia | 92.0 /100 | #110 | Exceptional 47.7% |
| Immigrants | Hungary | 91.2 /100 | #111 | Exceptional 47.6% |
| Immigrants | Western Europe | 91.1 /100 | #112 | Exceptional 47.6% |
| Immigrants | Denmark | 90.9 /100 | #113 | Exceptional 47.6% |
| South Africans | 90.5 /100 | #114 | Exceptional 47.6% |
| Immigrants | Indonesia | 90.5 /100 | #115 | Exceptional 47.6% |
| Palestinians | 90.4 /100 | #116 | Exceptional 47.6% |
| Puget Sound Salish | 90.3 /100 | #117 | Exceptional 47.6% |
| Immigrants | Philippines | 90.2 /100 | #118 | Exceptional 47.6% |
| Australians | 90.2 /100 | #119 | Exceptional 47.6% |
| Syrians | 88.9 /100 | #120 | Excellent 47.5% |
| Immigrants | Croatia | 88.6 /100 | #121 | Excellent 47.5% |
| Osage | 87.9 /100 | #122 | Excellent 47.5% |
| Immigrants | Kazakhstan | 87.2 /100 | #123 | Excellent 47.4% |
| Laotians | 86.6 /100 | #124 | Excellent 47.4% |
Demographics Similar to Blacks/African Americans by Currently Married
In terms of currently married, the demographic groups most similar to Blacks/African Americans are Cape Verdean (39.6%, a difference of 0.090%), Dominican (39.5%, a difference of 0.25%), British West Indian (39.8%, a difference of 0.38%), Lumbee (39.8%, a difference of 0.56%), and Puerto Rican (39.9%, a difference of 0.72%).
| Demographics | Rating | Rank | Currently Married |
| Immigrants | Dominica | 0.0 /100 | #330 | Tragic 40.3% |
| Immigrants | Barbados | 0.0 /100 | #331 | Tragic 40.3% |
| Immigrants | St. Vincent and the Grenadines | 0.0 /100 | #332 | Tragic 40.1% |
| Yup'ik | 0.0 /100 | #333 | Tragic 39.9% |
| Puerto Ricans | 0.0 /100 | #334 | Tragic 39.9% |
| Lumbee | 0.0 /100 | #335 | Tragic 39.8% |
| British West Indians | 0.0 /100 | #336 | Tragic 39.8% |
| Blacks/African Americans | 0.0 /100 | #337 | Tragic 39.6% |
| Cape Verdeans | 0.0 /100 | #338 | Tragic 39.6% |
| Dominicans | 0.0 /100 | #339 | Tragic 39.5% |
| Immigrants | Grenada | 0.0 /100 | #340 | Tragic 39.1% |
| Navajo | 0.0 /100 | #341 | Tragic 39.0% |
| Immigrants | Dominican Republic | 0.0 /100 | #342 | Tragic 38.9% |
| Pueblo | 0.0 /100 | #343 | Tragic 38.2% |
| Immigrants | Cabo Verde | 0.0 /100 | #344 | Tragic 37.8% |