Ethiopian vs Black/African American College, 1 year or more
COMPARE
Ethiopian
Black/African American
College, 1 year or more
College, 1 year or more Comparison
Ethiopians
Blacks/African Americans
62.9%
COLLEGE, 1 YEAR OR MORE
98.8/ 100
METRIC RATING
77th/ 347
METRIC RANK
53.3%
COLLEGE, 1 YEAR OR MORE
0.0/ 100
METRIC RATING
293rd/ 347
METRIC RANK
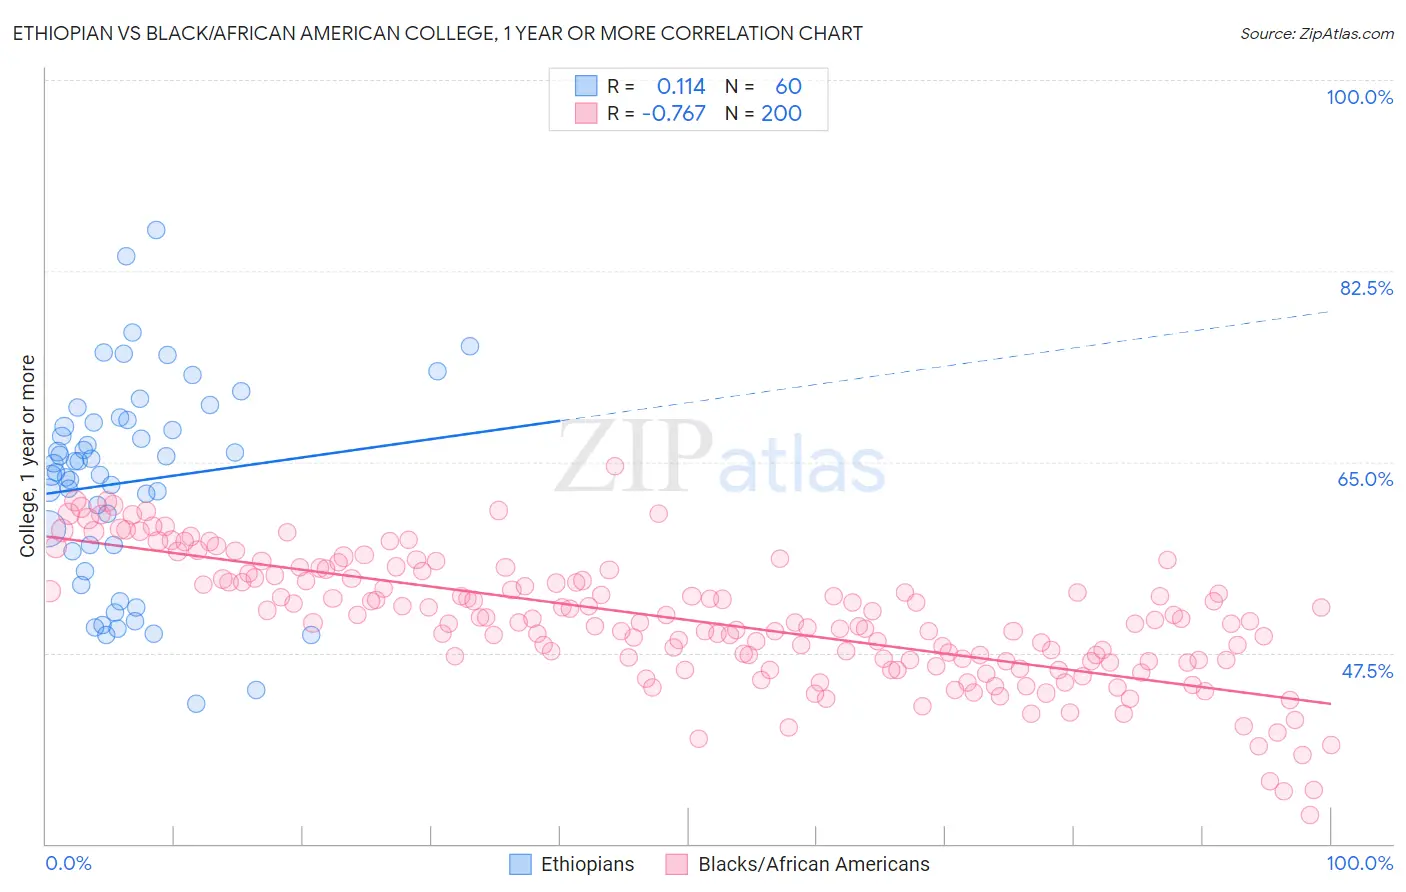
Ethiopian vs Black/African American College, 1 year or more Correlation Chart
The statistical analysis conducted on geographies consisting of 223,259,495 people shows a poor positive correlation between the proportion of Ethiopians and percentage of population with at least college, 1 year or more education in the United States with a correlation coefficient (R) of 0.114 and weighted average of 62.9%. Similarly, the statistical analysis conducted on geographies consisting of 566,034,160 people shows a strong negative correlation between the proportion of Blacks/African Americans and percentage of population with at least college, 1 year or more education in the United States with a correlation coefficient (R) of -0.767 and weighted average of 53.3%, a difference of 18.0%.
College, 1 year or more Correlation Summary
| Measurement | Ethiopian | Black/African American |
| Minimum | 42.8% | 32.6% |
| Maximum | 86.2% | 64.6% |
| Range | 43.5% | 32.0% |
| Mean | 63.2% | 50.5% |
| Median | 64.5% | 50.3% |
| Interquartile 25% (IQ1) | 57.1% | 46.8% |
| Interquartile 75% (IQ3) | 68.7% | 54.3% |
| Interquartile Range (IQR) | 11.6% | 7.5% |
| Standard Deviation (Sample) | 9.3% | 5.8% |
| Standard Deviation (Population) | 9.2% | 5.8% |
Similar Demographics by College, 1 year or more
Demographics Similar to Ethiopians by College, 1 year or more
In terms of college, 1 year or more, the demographic groups most similar to Ethiopians are Paraguayan (62.9%, a difference of 0.0%), Immigrants from Lebanon (62.9%, a difference of 0.020%), Northern European (62.9%, a difference of 0.030%), Lithuanian (62.9%, a difference of 0.070%), and Armenian (63.0%, a difference of 0.10%).
| Demographics | Rating | Rank | College, 1 year or more |
| Argentineans | 99.2 /100 | #70 | Exceptional 63.2% |
| Immigrants | Canada | 99.1 /100 | #71 | Exceptional 63.1% |
| Egyptians | 99.0 /100 | #72 | Exceptional 63.1% |
| Immigrants | Moldova | 99.0 /100 | #73 | Exceptional 63.0% |
| Immigrants | North America | 99.0 /100 | #74 | Exceptional 63.0% |
| Armenians | 98.9 /100 | #75 | Exceptional 63.0% |
| Paraguayans | 98.8 /100 | #76 | Exceptional 62.9% |
| Ethiopians | 98.8 /100 | #77 | Exceptional 62.9% |
| Immigrants | Lebanon | 98.8 /100 | #78 | Exceptional 62.9% |
| Northern Europeans | 98.8 /100 | #79 | Exceptional 62.9% |
| Lithuanians | 98.8 /100 | #80 | Exceptional 62.9% |
| Laotians | 98.7 /100 | #81 | Exceptional 62.8% |
| Immigrants | Bolivia | 98.7 /100 | #82 | Exceptional 62.8% |
| Immigrants | Argentina | 98.6 /100 | #83 | Exceptional 62.8% |
| Immigrants | England | 98.6 /100 | #84 | Exceptional 62.8% |
Demographics Similar to Blacks/African Americans by College, 1 year or more
In terms of college, 1 year or more, the demographic groups most similar to Blacks/African Americans are Chickasaw (53.3%, a difference of 0.020%), Cuban (53.4%, a difference of 0.15%), Alaskan Athabascan (53.4%, a difference of 0.20%), Cherokee (53.2%, a difference of 0.21%), and Alaska Native (53.4%, a difference of 0.22%).
| Demographics | Rating | Rank | College, 1 year or more |
| Central American Indians | 0.1 /100 | #286 | Tragic 53.5% |
| Immigrants | Belize | 0.1 /100 | #287 | Tragic 53.5% |
| Alaska Natives | 0.0 /100 | #288 | Tragic 53.4% |
| Immigrants | Ecuador | 0.0 /100 | #289 | Tragic 53.4% |
| Alaskan Athabascans | 0.0 /100 | #290 | Tragic 53.4% |
| Cubans | 0.0 /100 | #291 | Tragic 53.4% |
| Chickasaw | 0.0 /100 | #292 | Tragic 53.3% |
| Blacks/African Americans | 0.0 /100 | #293 | Tragic 53.3% |
| Cherokee | 0.0 /100 | #294 | Tragic 53.2% |
| Yaqui | 0.0 /100 | #295 | Tragic 53.2% |
| Sioux | 0.0 /100 | #296 | Tragic 53.0% |
| Paiute | 0.0 /100 | #297 | Tragic 52.9% |
| Immigrants | Dominica | 0.0 /100 | #298 | Tragic 52.5% |
| Immigrants | Nicaragua | 0.0 /100 | #299 | Tragic 52.4% |
| Choctaw | 0.0 /100 | #300 | Tragic 52.3% |