Delaware vs Portuguese Births to Unmarried Women
COMPARE
Delaware
Portuguese
Births to Unmarried Women
Births to Unmarried Women Comparison
Delaware
Portuguese
34.2%
BIRTHS TO UNMARRIED WOMEN
3.3/ 100
METRIC RATING
226th/ 347
METRIC RANK
33.8%
BIRTHS TO UNMARRIED WOMEN
5.4/ 100
METRIC RATING
220th/ 347
METRIC RANK
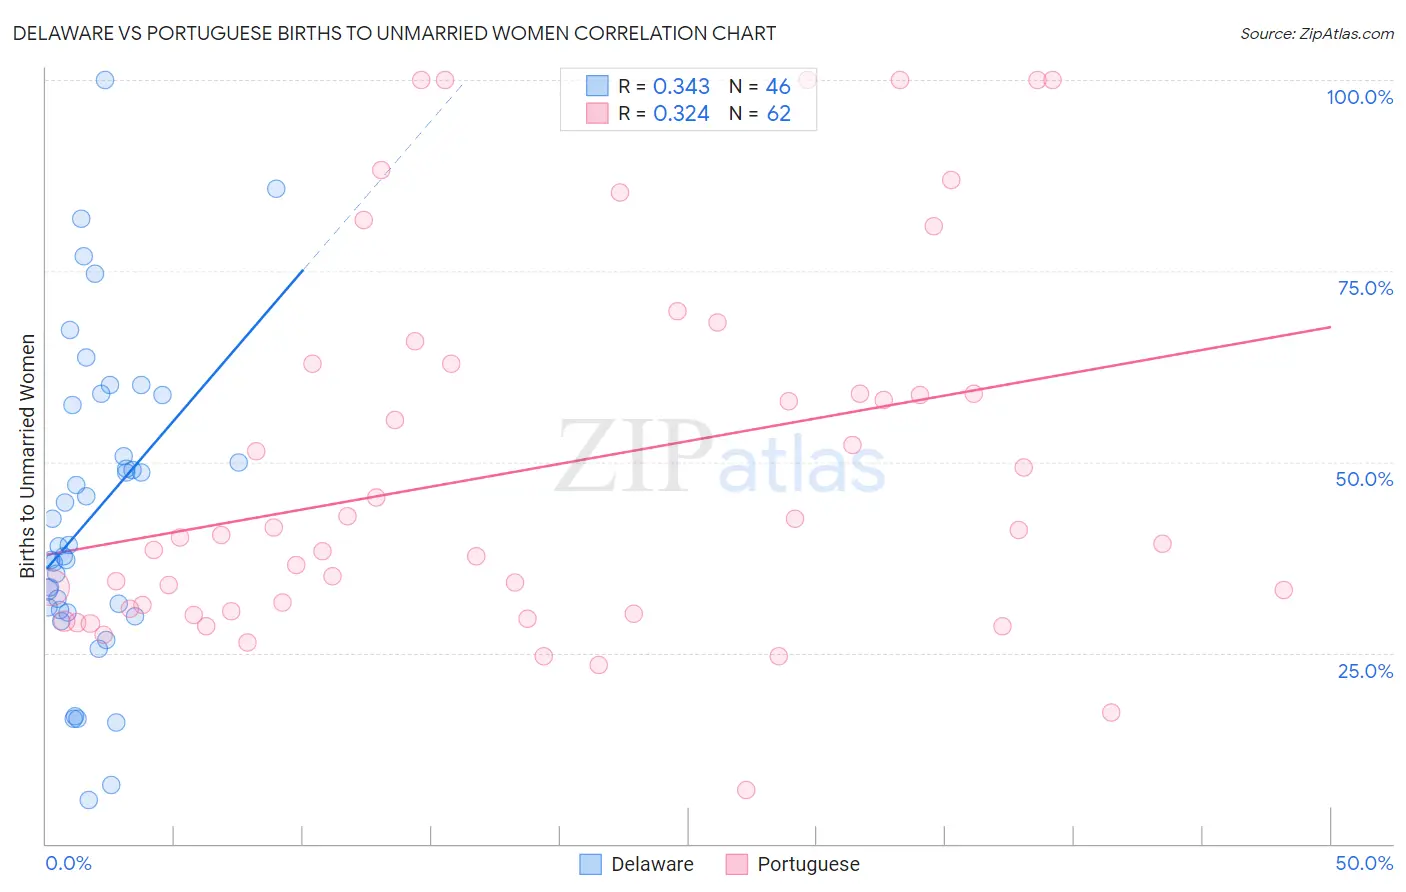
Delaware vs Portuguese Births to Unmarried Women Correlation Chart
The statistical analysis conducted on geographies consisting of 93,888,515 people shows a mild positive correlation between the proportion of Delaware and percentage of births to unmarried women in the United States with a correlation coefficient (R) of 0.343 and weighted average of 34.2%. Similarly, the statistical analysis conducted on geographies consisting of 413,543,833 people shows a mild positive correlation between the proportion of Portuguese and percentage of births to unmarried women in the United States with a correlation coefficient (R) of 0.324 and weighted average of 33.8%, a difference of 1.1%.
Births to Unmarried Women Correlation Summary
| Measurement | Delaware | Portuguese |
| Minimum | 5.8% | 7.1% |
| Maximum | 100.0% | 100.0% |
| Range | 94.2% | 92.9% |
| Mean | 43.4% | 49.2% |
| Median | 39.0% | 40.3% |
| Interquartile 25% (IQ1) | 30.6% | 30.5% |
| Interquartile 75% (IQ3) | 57.4% | 62.8% |
| Interquartile Range (IQR) | 26.8% | 32.3% |
| Standard Deviation (Sample) | 20.5% | 24.4% |
| Standard Deviation (Population) | 20.2% | 24.2% |
Demographics Similar to Delaware and Portuguese by Births to Unmarried Women
In terms of births to unmarried women, the demographic groups most similar to Delaware are Immigrants from Panama (34.2%, a difference of 0.010%), Panamanian (34.2%, a difference of 0.050%), Immigrants from Sierra Leone (34.2%, a difference of 0.16%), Ghanaian (34.3%, a difference of 0.18%), and Native Hawaiian (34.3%, a difference of 0.32%). Similarly, the demographic groups most similar to Portuguese are Alsatian (33.8%, a difference of 0.020%), Malaysian (33.9%, a difference of 0.17%), Immigrants from Ecuador (33.7%, a difference of 0.24%), Immigrants from Uruguay (33.9%, a difference of 0.24%), and Pennsylvania German (34.0%, a difference of 0.53%).
| Demographics | Rating | Rank | Births to Unmarried Women |
| Immigrants | Costa Rica | 9.5 /100 | #213 | Tragic 33.4% |
| Slovaks | 9.3 /100 | #214 | Tragic 33.4% |
| French | 8.7 /100 | #215 | Tragic 33.4% |
| Nepalese | 7.8 /100 | #216 | Tragic 33.5% |
| Spaniards | 7.0 /100 | #217 | Tragic 33.6% |
| Immigrants | Ecuador | 5.9 /100 | #218 | Tragic 33.7% |
| Alsatians | 5.4 /100 | #219 | Tragic 33.8% |
| Portuguese | 5.4 /100 | #220 | Tragic 33.8% |
| Malaysians | 5.0 /100 | #221 | Tragic 33.9% |
| Immigrants | Uruguay | 4.8 /100 | #222 | Tragic 33.9% |
| Pennsylvania Germans | 4.3 /100 | #223 | Tragic 34.0% |
| Immigrants | Laos | 4.3 /100 | #224 | Tragic 34.0% |
| Spanish | 4.0 /100 | #225 | Tragic 34.1% |
| Delaware | 3.3 /100 | #226 | Tragic 34.2% |
| Immigrants | Panama | 3.3 /100 | #227 | Tragic 34.2% |
| Panamanians | 3.3 /100 | #228 | Tragic 34.2% |
| Immigrants | Sierra Leone | 3.1 /100 | #229 | Tragic 34.2% |
| Ghanaians | 3.1 /100 | #230 | Tragic 34.3% |
| Native Hawaiians | 2.9 /100 | #231 | Tragic 34.3% |
| French Canadians | 2.5 /100 | #232 | Tragic 34.4% |
| Bangladeshis | 2.5 /100 | #233 | Tragic 34.4% |