Delaware vs Nigerian Births to Unmarried Women
COMPARE
Delaware
Nigerian
Births to Unmarried Women
Births to Unmarried Women Comparison
Delaware
Nigerians
34.2%
BIRTHS TO UNMARRIED WOMEN
3.3/ 100
METRIC RATING
226th/ 347
METRIC RANK
35.3%
BIRTHS TO UNMARRIED WOMEN
0.7/ 100
METRIC RATING
246th/ 347
METRIC RANK
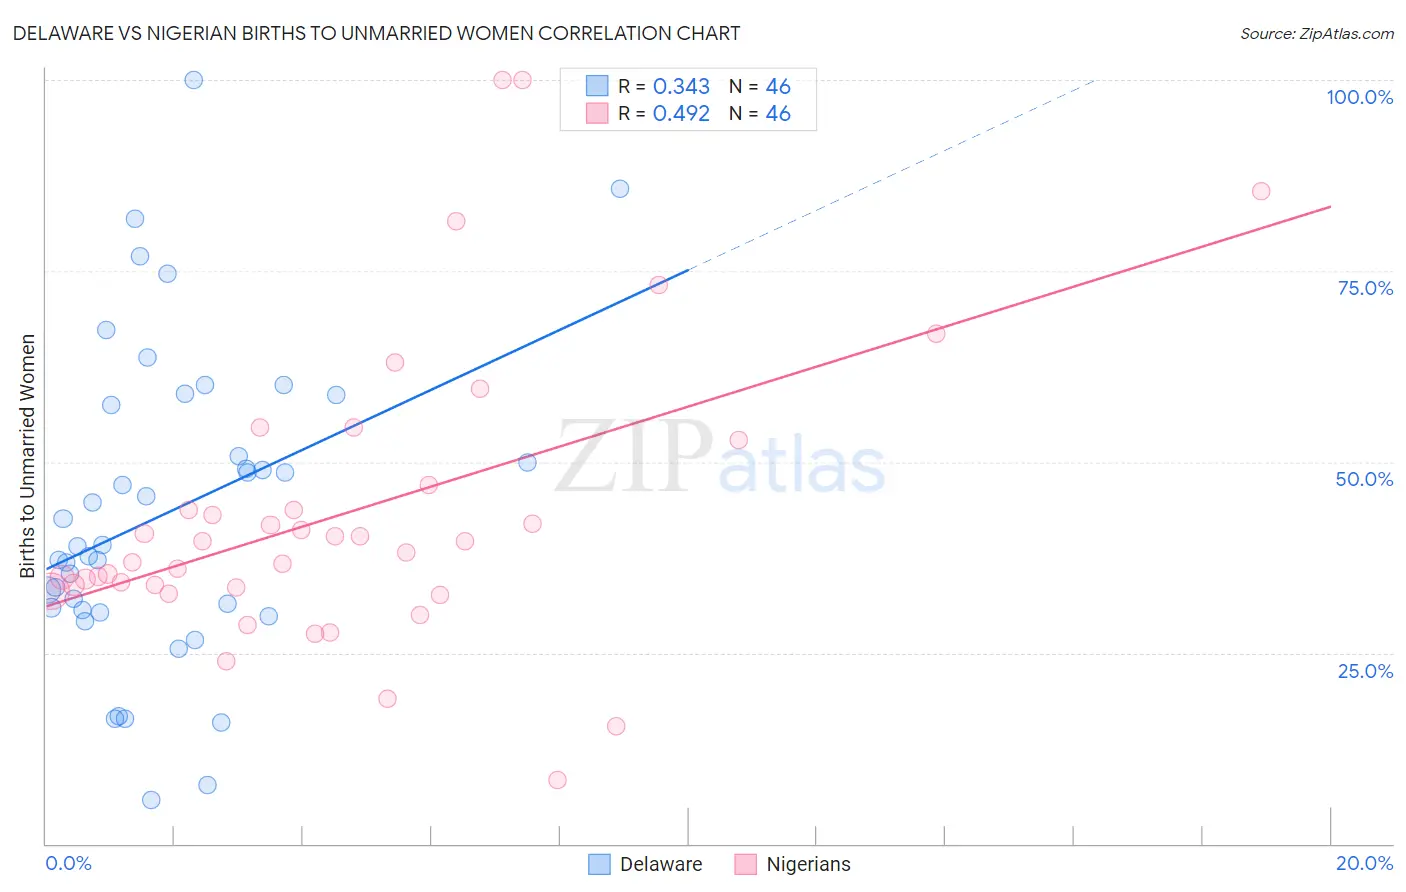
Delaware vs Nigerian Births to Unmarried Women Correlation Chart
The statistical analysis conducted on geographies consisting of 93,888,515 people shows a mild positive correlation between the proportion of Delaware and percentage of births to unmarried women in the United States with a correlation coefficient (R) of 0.343 and weighted average of 34.2%. Similarly, the statistical analysis conducted on geographies consisting of 318,352,588 people shows a moderate positive correlation between the proportion of Nigerians and percentage of births to unmarried women in the United States with a correlation coefficient (R) of 0.492 and weighted average of 35.3%, a difference of 3.4%.
Births to Unmarried Women Correlation Summary
| Measurement | Delaware | Nigerian |
| Minimum | 5.8% | 8.3% |
| Maximum | 100.0% | 100.0% |
| Range | 94.2% | 91.7% |
| Mean | 43.4% | 43.4% |
| Median | 39.0% | 38.8% |
| Interquartile 25% (IQ1) | 30.6% | 33.6% |
| Interquartile 75% (IQ3) | 57.4% | 46.9% |
| Interquartile Range (IQR) | 26.8% | 13.3% |
| Standard Deviation (Sample) | 20.5% | 19.5% |
| Standard Deviation (Population) | 20.2% | 19.3% |
Demographics Similar to Delaware and Nigerians by Births to Unmarried Women
In terms of births to unmarried women, the demographic groups most similar to Delaware are Immigrants from Panama (34.2%, a difference of 0.010%), Panamanian (34.2%, a difference of 0.050%), Immigrants from Sierra Leone (34.2%, a difference of 0.16%), Ghanaian (34.3%, a difference of 0.18%), and Native Hawaiian (34.3%, a difference of 0.32%). Similarly, the demographic groups most similar to Nigerians are Shoshone (35.3%, a difference of 0.11%), Guyanese (35.2%, a difference of 0.45%), Japanese (35.2%, a difference of 0.51%), Indonesian (35.0%, a difference of 1.0%), and Immigrants from Guyana (35.0%, a difference of 1.1%).
| Demographics | Rating | Rank | Births to Unmarried Women |
| Delaware | 3.3 /100 | #226 | Tragic 34.2% |
| Immigrants | Panama | 3.3 /100 | #227 | Tragic 34.2% |
| Panamanians | 3.3 /100 | #228 | Tragic 34.2% |
| Immigrants | Sierra Leone | 3.1 /100 | #229 | Tragic 34.2% |
| Ghanaians | 3.1 /100 | #230 | Tragic 34.3% |
| Native Hawaiians | 2.9 /100 | #231 | Tragic 34.3% |
| French Canadians | 2.5 /100 | #232 | Tragic 34.4% |
| Bangladeshis | 2.5 /100 | #233 | Tragic 34.4% |
| Immigrants | Zaire | 2.3 /100 | #234 | Tragic 34.5% |
| Immigrants | Ghana | 2.2 /100 | #235 | Tragic 34.5% |
| Immigrants | Cameroon | 1.6 /100 | #236 | Tragic 34.7% |
| Marshallese | 1.6 /100 | #237 | Tragic 34.8% |
| Immigrants | Cambodia | 1.6 /100 | #238 | Tragic 34.8% |
| Sierra Leoneans | 1.4 /100 | #239 | Tragic 34.9% |
| Immigrants | Middle Africa | 1.2 /100 | #240 | Tragic 34.9% |
| Immigrants | Guyana | 1.2 /100 | #241 | Tragic 35.0% |
| Indonesians | 1.2 /100 | #242 | Tragic 35.0% |
| Japanese | 0.9 /100 | #243 | Tragic 35.2% |
| Guyanese | 0.9 /100 | #244 | Tragic 35.2% |
| Shoshone | 0.8 /100 | #245 | Tragic 35.3% |
| Nigerians | 0.7 /100 | #246 | Tragic 35.3% |