Delaware vs Sioux Births to Unmarried Women
COMPARE
Delaware
Sioux
Births to Unmarried Women
Births to Unmarried Women Comparison
Delaware
Sioux
34.2%
BIRTHS TO UNMARRIED WOMEN
3.3/ 100
METRIC RATING
226th/ 347
METRIC RANK
41.0%
BIRTHS TO UNMARRIED WOMEN
0.0/ 100
METRIC RATING
323rd/ 347
METRIC RANK
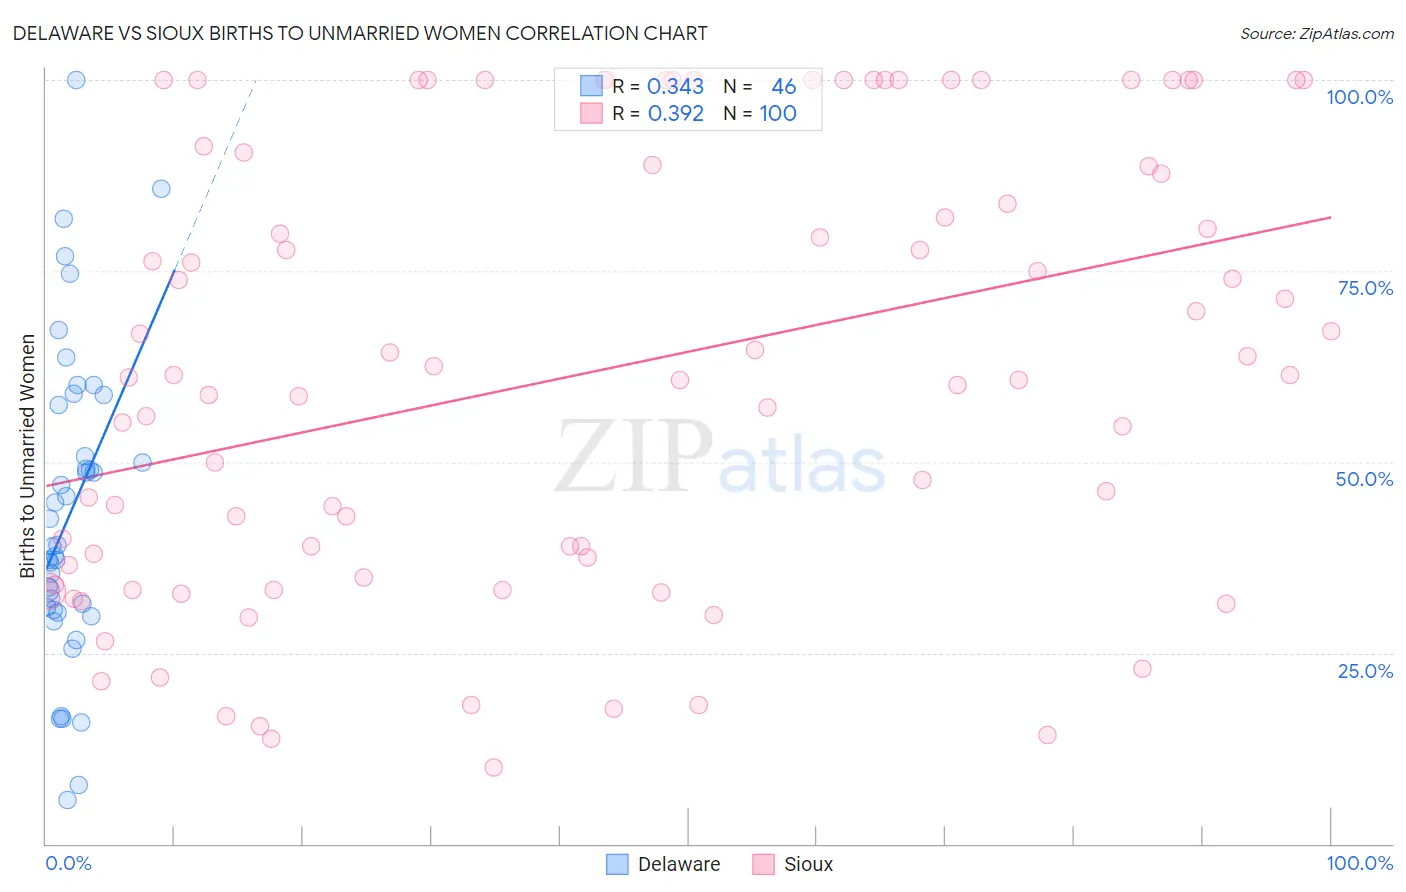
Delaware vs Sioux Births to Unmarried Women Correlation Chart
The statistical analysis conducted on geographies consisting of 93,888,515 people shows a mild positive correlation between the proportion of Delaware and percentage of births to unmarried women in the United States with a correlation coefficient (R) of 0.343 and weighted average of 34.2%. Similarly, the statistical analysis conducted on geographies consisting of 224,573,646 people shows a mild positive correlation between the proportion of Sioux and percentage of births to unmarried women in the United States with a correlation coefficient (R) of 0.392 and weighted average of 41.0%, a difference of 19.9%.
Births to Unmarried Women Correlation Summary
| Measurement | Delaware | Sioux |
| Minimum | 5.8% | 10.0% |
| Maximum | 100.0% | 100.0% |
| Range | 94.2% | 90.0% |
| Mean | 43.4% | 61.9% |
| Median | 39.0% | 61.2% |
| Interquartile 25% (IQ1) | 30.6% | 35.7% |
| Interquartile 75% (IQ3) | 57.4% | 89.7% |
| Interquartile Range (IQR) | 26.8% | 54.0% |
| Standard Deviation (Sample) | 20.5% | 28.7% |
| Standard Deviation (Population) | 20.2% | 28.5% |
Similar Demographics by Births to Unmarried Women
Demographics Similar to Delaware by Births to Unmarried Women
In terms of births to unmarried women, the demographic groups most similar to Delaware are Immigrants from Panama (34.2%, a difference of 0.010%), Panamanian (34.2%, a difference of 0.050%), Immigrants from Sierra Leone (34.2%, a difference of 0.16%), Ghanaian (34.3%, a difference of 0.18%), and Native Hawaiian (34.3%, a difference of 0.32%).
| Demographics | Rating | Rank | Births to Unmarried Women |
| Alsatians | 5.4 /100 | #219 | Tragic 33.8% |
| Portuguese | 5.4 /100 | #220 | Tragic 33.8% |
| Malaysians | 5.0 /100 | #221 | Tragic 33.9% |
| Immigrants | Uruguay | 4.8 /100 | #222 | Tragic 33.9% |
| Pennsylvania Germans | 4.3 /100 | #223 | Tragic 34.0% |
| Immigrants | Laos | 4.3 /100 | #224 | Tragic 34.0% |
| Spanish | 4.0 /100 | #225 | Tragic 34.1% |
| Delaware | 3.3 /100 | #226 | Tragic 34.2% |
| Immigrants | Panama | 3.3 /100 | #227 | Tragic 34.2% |
| Panamanians | 3.3 /100 | #228 | Tragic 34.2% |
| Immigrants | Sierra Leone | 3.1 /100 | #229 | Tragic 34.2% |
| Ghanaians | 3.1 /100 | #230 | Tragic 34.3% |
| Native Hawaiians | 2.9 /100 | #231 | Tragic 34.3% |
| French Canadians | 2.5 /100 | #232 | Tragic 34.4% |
| Bangladeshis | 2.5 /100 | #233 | Tragic 34.4% |
Demographics Similar to Sioux by Births to Unmarried Women
In terms of births to unmarried women, the demographic groups most similar to Sioux are Cajun (41.0%, a difference of 0.070%), Bahamian (40.8%, a difference of 0.56%), Cape Verdean (41.3%, a difference of 0.80%), Cheyenne (41.3%, a difference of 0.85%), and Immigrants from Cuba (41.5%, a difference of 1.1%).
| Demographics | Rating | Rank | Births to Unmarried Women |
| Apache | 0.0 /100 | #316 | Tragic 39.9% |
| Immigrants | Dominican Republic | 0.0 /100 | #317 | Tragic 40.1% |
| Immigrants | Bahamas | 0.0 /100 | #318 | Tragic 40.1% |
| Yakama | 0.0 /100 | #319 | Tragic 40.3% |
| Crow | 0.0 /100 | #320 | Tragic 40.4% |
| Bahamians | 0.0 /100 | #321 | Tragic 40.8% |
| Cajuns | 0.0 /100 | #322 | Tragic 41.0% |
| Sioux | 0.0 /100 | #323 | Tragic 41.0% |
| Cape Verdeans | 0.0 /100 | #324 | Tragic 41.3% |
| Cheyenne | 0.0 /100 | #325 | Tragic 41.3% |
| Immigrants | Cuba | 0.0 /100 | #326 | Tragic 41.5% |
| Tsimshian | 0.0 /100 | #327 | Tragic 42.2% |
| Immigrants | Cabo Verde | 0.0 /100 | #328 | Tragic 42.2% |
| Paiute | 0.0 /100 | #329 | Tragic 42.5% |
| Chippewa | 0.0 /100 | #330 | Tragic 42.6% |