Delaware vs Immigrants from Sudan Family Households
COMPARE
Delaware
Immigrants from Sudan
Family Households
Family Households Comparison
Delaware
Immigrants from Sudan
64.6%
FAMILY HOUSEHOLDS
76.3/ 100
METRIC RATING
148th/ 347
METRIC RANK
60.2%
FAMILY HOUSEHOLDS
0.0/ 100
METRIC RATING
340th/ 347
METRIC RANK
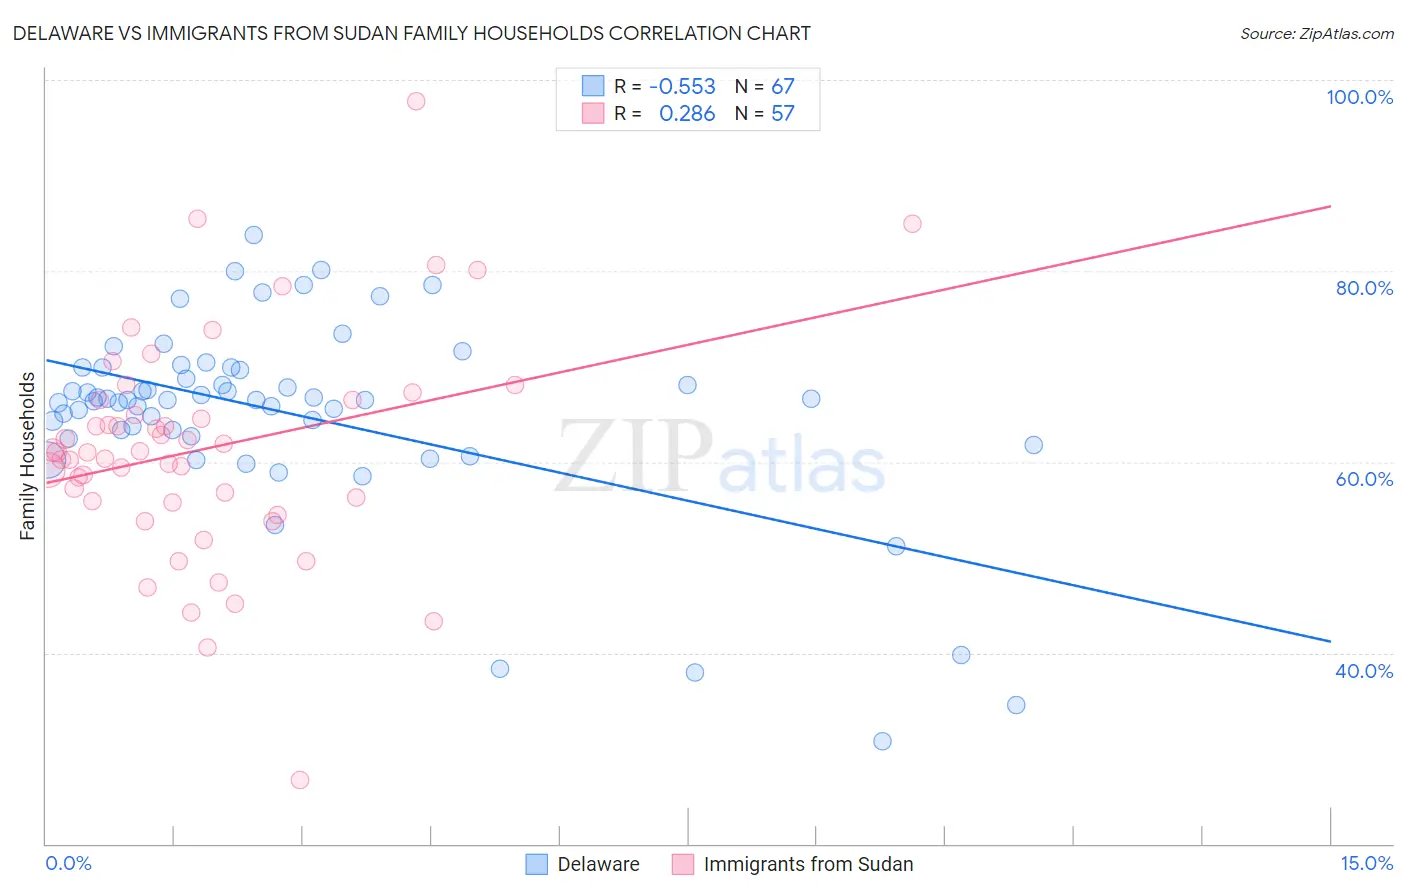
Delaware vs Immigrants from Sudan Family Households Correlation Chart
The statistical analysis conducted on geographies consisting of 96,227,636 people shows a substantial negative correlation between the proportion of Delaware and percentage of family households in the United States with a correlation coefficient (R) of -0.553 and weighted average of 64.6%. Similarly, the statistical analysis conducted on geographies consisting of 118,943,916 people shows a weak positive correlation between the proportion of Immigrants from Sudan and percentage of family households in the United States with a correlation coefficient (R) of 0.286 and weighted average of 60.2%, a difference of 7.3%.
Family Households Correlation Summary
| Measurement | Delaware | Immigrants from Sudan |
| Minimum | 30.8% | 26.6% |
| Maximum | 83.8% | 97.8% |
| Range | 53.1% | 71.1% |
| Mean | 65.0% | 61.4% |
| Median | 66.5% | 61.0% |
| Interquartile 25% (IQ1) | 62.6% | 55.8% |
| Interquartile 75% (IQ3) | 69.9% | 66.4% |
| Interquartile Range (IQR) | 7.2% | 10.6% |
| Standard Deviation (Sample) | 10.2% | 11.8% |
| Standard Deviation (Population) | 10.1% | 11.7% |
Similar Demographics by Family Households
Demographics Similar to Delaware by Family Households
In terms of family households, the demographic groups most similar to Delaware are Immigrants from Chile (64.6%, a difference of 0.0%), Sioux (64.6%, a difference of 0.0%), Immigrants from Romania (64.6%, a difference of 0.010%), Romanian (64.5%, a difference of 0.020%), and Syrian (64.5%, a difference of 0.020%).
| Demographics | Rating | Rank | Family Households |
| Immigrants | Cameroon | 84.8 /100 | #141 | Excellent 64.7% |
| Pakistanis | 84.0 /100 | #142 | Excellent 64.7% |
| Czechoslovakians | 82.1 /100 | #143 | Excellent 64.6% |
| South American Indians | 81.9 /100 | #144 | Excellent 64.6% |
| Welsh | 80.1 /100 | #145 | Excellent 64.6% |
| Immigrants | Romania | 77.0 /100 | #146 | Good 64.6% |
| Immigrants | Chile | 76.5 /100 | #147 | Good 64.6% |
| Delaware | 76.3 /100 | #148 | Good 64.6% |
| Sioux | 76.3 /100 | #149 | Good 64.6% |
| Romanians | 75.3 /100 | #150 | Good 64.5% |
| Syrians | 75.2 /100 | #151 | Good 64.5% |
| Scottish | 70.9 /100 | #152 | Good 64.5% |
| Swedes | 69.8 /100 | #153 | Good 64.5% |
| Austrians | 68.5 /100 | #154 | Good 64.5% |
| Uruguayans | 67.7 /100 | #155 | Good 64.5% |
Demographics Similar to Immigrants from Sudan by Family Households
In terms of family households, the demographic groups most similar to Immigrants from Sudan are Immigrants from Senegal (60.1%, a difference of 0.080%), Sudanese (60.0%, a difference of 0.27%), Senegalese (59.8%, a difference of 0.57%), Immigrants from Saudi Arabia (60.7%, a difference of 0.89%), and Immigrants from Eritrea (60.8%, a difference of 1.1%).
| Demographics | Rating | Rank | Family Households |
| Immigrants | Ethiopia | 0.0 /100 | #333 | Tragic 61.2% |
| Immigrants | Eastern Africa | 0.0 /100 | #334 | Tragic 61.1% |
| Carpatho Rusyns | 0.0 /100 | #335 | Tragic 61.1% |
| German Russians | 0.0 /100 | #336 | Tragic 60.9% |
| Soviet Union | 0.0 /100 | #337 | Tragic 60.9% |
| Immigrants | Eritrea | 0.0 /100 | #338 | Tragic 60.8% |
| Immigrants | Saudi Arabia | 0.0 /100 | #339 | Tragic 60.7% |
| Immigrants | Sudan | 0.0 /100 | #340 | Tragic 60.2% |
| Immigrants | Senegal | 0.0 /100 | #341 | Tragic 60.1% |
| Sudanese | 0.0 /100 | #342 | Tragic 60.0% |
| Senegalese | 0.0 /100 | #343 | Tragic 59.8% |
| Immigrants | Congo | 0.0 /100 | #344 | Tragic 59.2% |
| Immigrants | Zaire | 0.0 /100 | #345 | Tragic 59.2% |
| Somalis | 0.0 /100 | #346 | Tragic 57.6% |
| Immigrants | Somalia | 0.0 /100 | #347 | Tragic 56.7% |