Immigrants from Burma/Myanmar vs Soviet Union Currently Married
COMPARE
Immigrants from Burma/Myanmar
Soviet Union
Currently Married
Currently Married Comparison
Immigrants from Burma/Myanmar
Soviet Union
44.3%
CURRENTLY MARRIED
0.4/ 100
METRIC RATING
246th/ 347
METRIC RANK
46.2%
CURRENTLY MARRIED
25.7/ 100
METRIC RATING
192nd/ 347
METRIC RANK
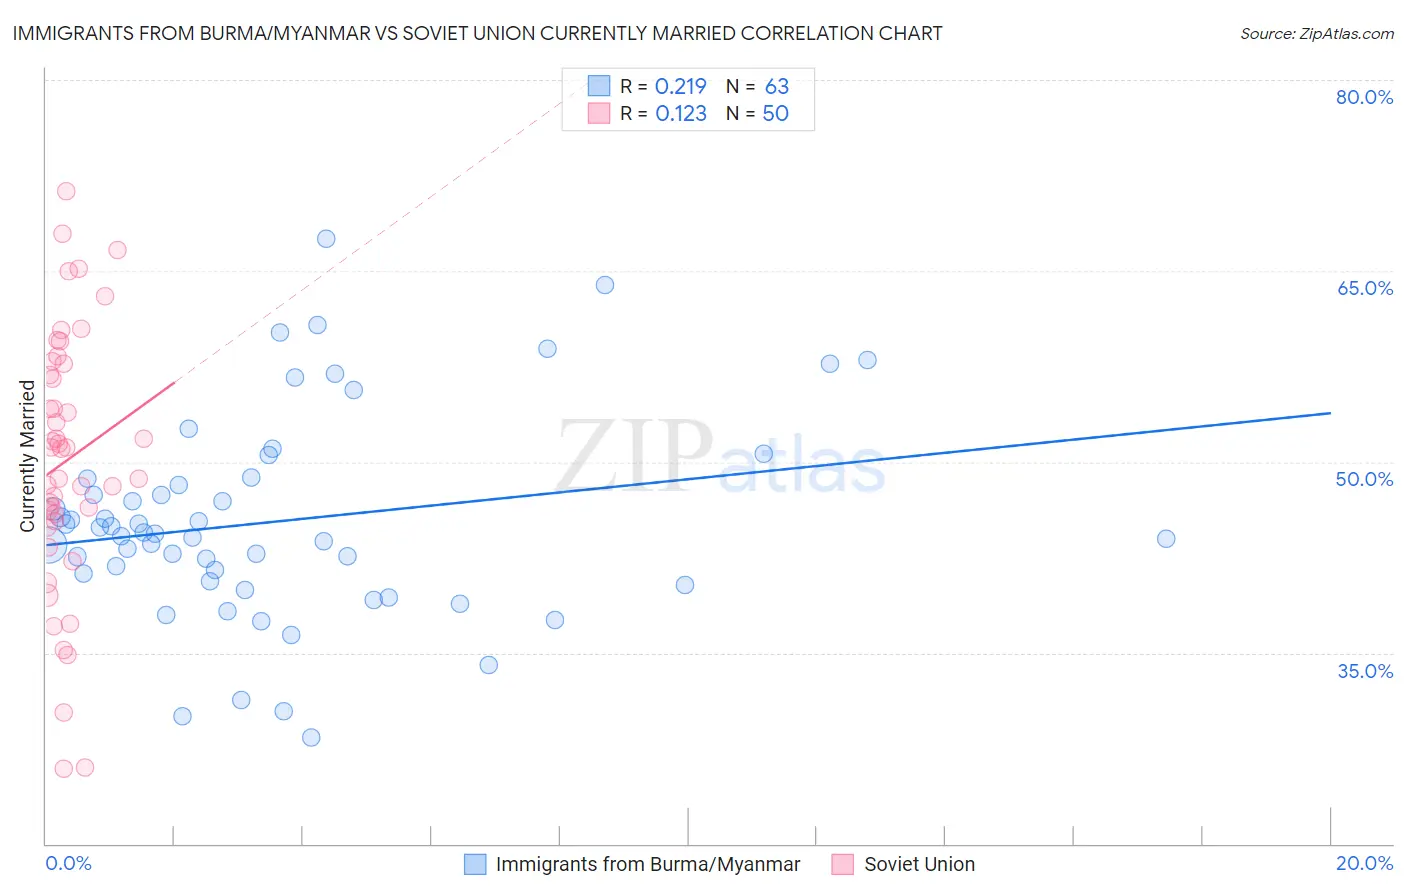
Immigrants from Burma/Myanmar vs Soviet Union Currently Married Correlation Chart
The statistical analysis conducted on geographies consisting of 172,355,169 people shows a weak positive correlation between the proportion of Immigrants from Burma/Myanmar and percentage of population currently married in the United States with a correlation coefficient (R) of 0.219 and weighted average of 44.3%. Similarly, the statistical analysis conducted on geographies consisting of 43,514,626 people shows a poor positive correlation between the proportion of Soviet Union and percentage of population currently married in the United States with a correlation coefficient (R) of 0.123 and weighted average of 46.2%, a difference of 4.3%.
Currently Married Correlation Summary
| Measurement | Immigrants from Burma/Myanmar | Soviet Union |
| Minimum | 28.3% | 25.9% |
| Maximum | 67.5% | 71.3% |
| Range | 39.2% | 45.4% |
| Mean | 45.3% | 50.1% |
| Median | 44.3% | 51.1% |
| Interquartile 25% (IQ1) | 40.6% | 45.4% |
| Interquartile 75% (IQ3) | 48.7% | 57.7% |
| Interquartile Range (IQR) | 8.0% | 12.3% |
| Standard Deviation (Sample) | 8.1% | 10.3% |
| Standard Deviation (Population) | 8.0% | 10.2% |
Similar Demographics by Currently Married
Demographics Similar to Immigrants from Burma/Myanmar by Currently Married
In terms of currently married, the demographic groups most similar to Immigrants from Burma/Myanmar are Immigrants from Armenia (44.3%, a difference of 0.070%), Ugandan (44.2%, a difference of 0.13%), Nicaraguan (44.2%, a difference of 0.22%), Immigrants from Cameroon (44.2%, a difference of 0.24%), and Immigrants from Eastern Africa (44.2%, a difference of 0.26%).
| Demographics | Rating | Rank | Currently Married |
| Immigrants | Mexico | 0.7 /100 | #239 | Tragic 44.5% |
| Mexican American Indians | 0.7 /100 | #240 | Tragic 44.5% |
| Ethiopians | 0.7 /100 | #241 | Tragic 44.5% |
| Immigrants | Cambodia | 0.7 /100 | #242 | Tragic 44.5% |
| Immigrants | Ethiopia | 0.7 /100 | #243 | Tragic 44.5% |
| Japanese | 0.6 /100 | #244 | Tragic 44.5% |
| Immigrants | Armenia | 0.4 /100 | #245 | Tragic 44.3% |
| Immigrants | Burma/Myanmar | 0.4 /100 | #246 | Tragic 44.3% |
| Ugandans | 0.4 /100 | #247 | Tragic 44.2% |
| Nicaraguans | 0.3 /100 | #248 | Tragic 44.2% |
| Immigrants | Cameroon | 0.3 /100 | #249 | Tragic 44.2% |
| Immigrants | Eastern Africa | 0.3 /100 | #250 | Tragic 44.2% |
| Blackfeet | 0.3 /100 | #251 | Tragic 44.2% |
| Hispanics or Latinos | 0.3 /100 | #252 | Tragic 44.1% |
| Immigrants | Central America | 0.3 /100 | #253 | Tragic 44.1% |
Demographics Similar to Soviet Union by Currently Married
In terms of currently married, the demographic groups most similar to Soviet Union are Immigrants from Fiji (46.2%, a difference of 0.040%), Immigrants from France (46.2%, a difference of 0.090%), South American (46.1%, a difference of 0.10%), Immigrants from Nepal (46.1%, a difference of 0.10%), and Choctaw (46.3%, a difference of 0.16%).
| Demographics | Rating | Rank | Currently Married |
| Mongolians | 37.6 /100 | #185 | Fair 46.4% |
| Immigrants | Chile | 36.8 /100 | #186 | Fair 46.4% |
| Immigrants | Peru | 35.3 /100 | #187 | Fair 46.4% |
| Colombians | 31.8 /100 | #188 | Fair 46.3% |
| Fijians | 30.3 /100 | #189 | Fair 46.3% |
| Choctaw | 29.1 /100 | #190 | Fair 46.3% |
| Immigrants | France | 27.7 /100 | #191 | Fair 46.2% |
| Soviet Union | 25.7 /100 | #192 | Fair 46.2% |
| Immigrants | Fiji | 25.0 /100 | #193 | Fair 46.2% |
| South Americans | 23.8 /100 | #194 | Fair 46.1% |
| Immigrants | Nepal | 23.7 /100 | #195 | Fair 46.1% |
| Immigrants | Bosnia and Herzegovina | 22.2 /100 | #196 | Fair 46.1% |
| Immigrants | Kuwait | 21.7 /100 | #197 | Fair 46.1% |
| Immigrants | Colombia | 21.0 /100 | #198 | Fair 46.1% |
| Immigrants | Costa Rica | 19.6 /100 | #199 | Poor 46.0% |