Crow vs Soviet Union In Labor Force | Age > 16
COMPARE
Crow
Soviet Union
In Labor Force | Age > 16
In Labor Force | Age > 16 Comparison
Crow
Soviet Union
60.8%
IN LABOR FORCE | AGE > 16
0.0/ 100
METRIC RATING
332nd/ 347
METRIC RANK
65.0%
IN LABOR FORCE | AGE > 16
40.5/ 100
METRIC RATING
183rd/ 347
METRIC RANK
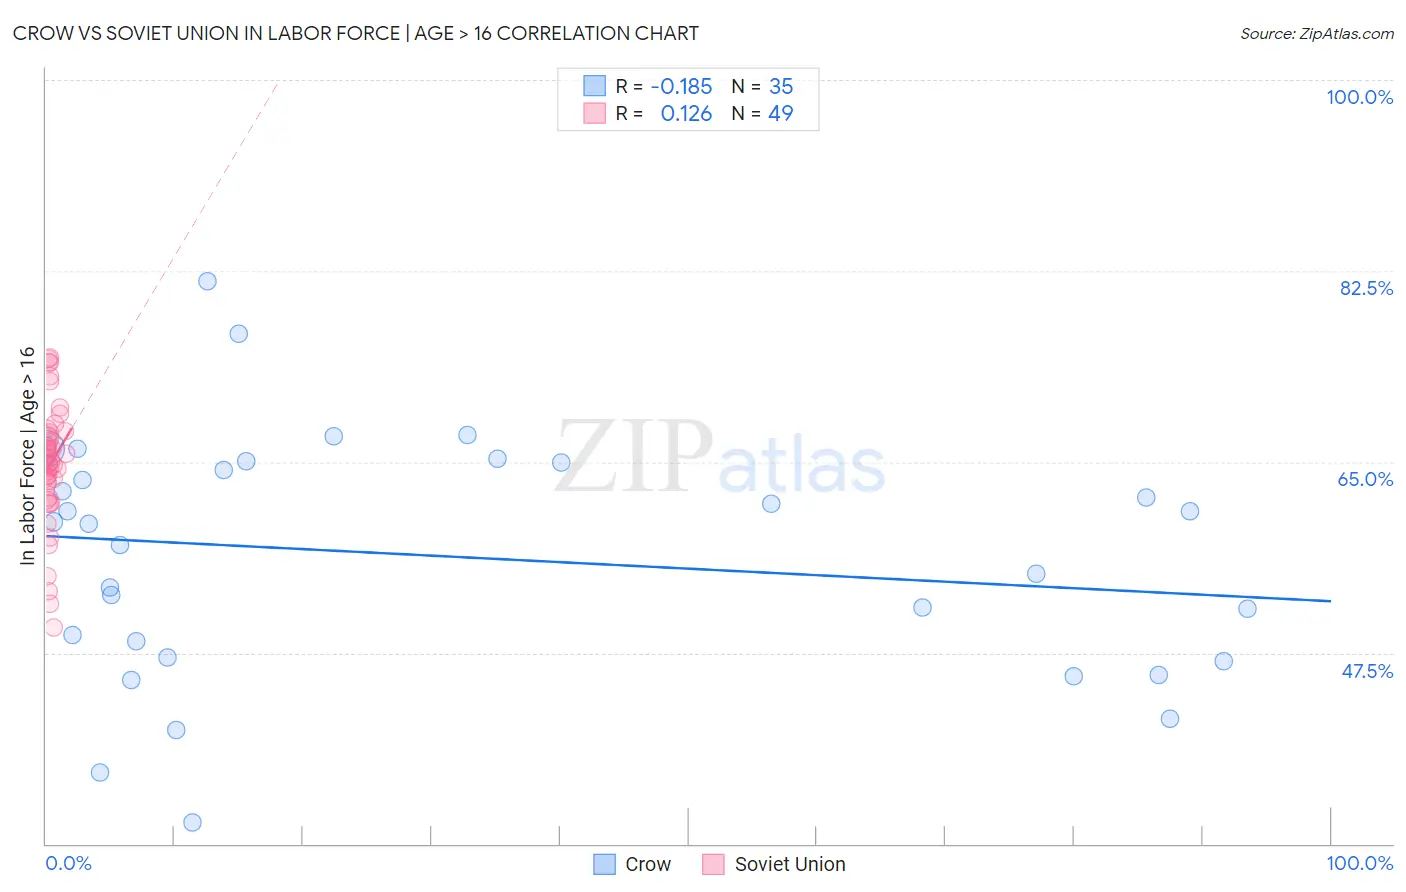
Crow vs Soviet Union In Labor Force | Age > 16 Correlation Chart
The statistical analysis conducted on geographies consisting of 59,204,758 people shows a poor negative correlation between the proportion of Crow and labor force participation rate among population ages 16 and over in the United States with a correlation coefficient (R) of -0.185 and weighted average of 60.8%. Similarly, the statistical analysis conducted on geographies consisting of 43,504,651 people shows a poor positive correlation between the proportion of Soviet Union and labor force participation rate among population ages 16 and over in the United States with a correlation coefficient (R) of 0.126 and weighted average of 65.0%, a difference of 7.0%.
In Labor Force | Age > 16 Correlation Summary
| Measurement | Crow | Soviet Union |
| Minimum | 31.9% | 49.8% |
| Maximum | 81.6% | 74.6% |
| Range | 49.7% | 24.8% |
| Mean | 56.4% | 64.8% |
| Median | 59.4% | 65.1% |
| Interquartile 25% (IQ1) | 47.1% | 62.4% |
| Interquartile 75% (IQ3) | 65.0% | 67.5% |
| Interquartile Range (IQR) | 17.9% | 5.1% |
| Standard Deviation (Sample) | 11.1% | 5.5% |
| Standard Deviation (Population) | 10.9% | 5.4% |
Similar Demographics by In Labor Force | Age > 16
Demographics Similar to Crow by In Labor Force | Age > 16
In terms of in labor force | age > 16, the demographic groups most similar to Crow are Paiute (60.7%, a difference of 0.080%), Apache (60.7%, a difference of 0.13%), Ute (60.9%, a difference of 0.17%), Native/Alaskan (60.6%, a difference of 0.31%), and Menominee (60.6%, a difference of 0.34%).
| Demographics | Rating | Rank | In Labor Force | Age > 16 |
| Cherokee | 0.0 /100 | #325 | Tragic 61.9% |
| Sioux | 0.0 /100 | #326 | Tragic 61.8% |
| Cajuns | 0.0 /100 | #327 | Tragic 61.8% |
| Dutch West Indians | 0.0 /100 | #328 | Tragic 61.7% |
| Choctaw | 0.0 /100 | #329 | Tragic 61.5% |
| Creek | 0.0 /100 | #330 | Tragic 61.3% |
| Ute | 0.0 /100 | #331 | Tragic 60.9% |
| Crow | 0.0 /100 | #332 | Tragic 60.8% |
| Paiute | 0.0 /100 | #333 | Tragic 60.7% |
| Apache | 0.0 /100 | #334 | Tragic 60.7% |
| Natives/Alaskans | 0.0 /100 | #335 | Tragic 60.6% |
| Menominee | 0.0 /100 | #336 | Tragic 60.6% |
| Colville | 0.0 /100 | #337 | Tragic 59.8% |
| Immigrants | Yemen | 0.0 /100 | #338 | Tragic 59.6% |
| Houma | 0.0 /100 | #339 | Tragic 59.5% |
Demographics Similar to Soviet Union by In Labor Force | Age > 16
In terms of in labor force | age > 16, the demographic groups most similar to Soviet Union are Immigrants from Nicaragua (65.1%, a difference of 0.010%), Carpatho Rusyn (65.0%, a difference of 0.010%), Syrian (65.0%, a difference of 0.010%), Immigrants from Panama (65.1%, a difference of 0.020%), and Immigrants from Haiti (65.1%, a difference of 0.030%).
| Demographics | Rating | Rank | In Labor Force | Age > 16 |
| Swedes | 47.4 /100 | #176 | Average 65.1% |
| Eastern Europeans | 46.2 /100 | #177 | Average 65.1% |
| Trinidadians and Tobagonians | 45.2 /100 | #178 | Average 65.1% |
| Immigrants | Haiti | 43.3 /100 | #179 | Average 65.1% |
| Immigrants | Latvia | 42.9 /100 | #180 | Average 65.1% |
| Immigrants | Panama | 42.4 /100 | #181 | Average 65.1% |
| Immigrants | Nicaragua | 41.1 /100 | #182 | Average 65.1% |
| Soviet Union | 40.5 /100 | #183 | Average 65.0% |
| Carpatho Rusyns | 40.0 /100 | #184 | Average 65.0% |
| Syrians | 40.0 /100 | #185 | Average 65.0% |
| Immigrants | Switzerland | 38.2 /100 | #186 | Fair 65.0% |
| Immigrants | Croatia | 35.7 /100 | #187 | Fair 65.0% |
| Immigrants | Portugal | 34.8 /100 | #188 | Fair 65.0% |
| Immigrants | Greece | 34.3 /100 | #189 | Fair 65.0% |
| Barbadians | 33.9 /100 | #190 | Fair 65.0% |