West Indian vs New Zealander Currently Married
COMPARE
West Indian
New Zealander
Currently Married
Currently Married Comparison
West Indians
New Zealanders
41.3%
CURRENTLY MARRIED
0.0/ 100
METRIC RATING
314th/ 347
METRIC RANK
47.4%
CURRENTLY MARRIED
84.9/ 100
METRIC RATING
127th/ 347
METRIC RANK
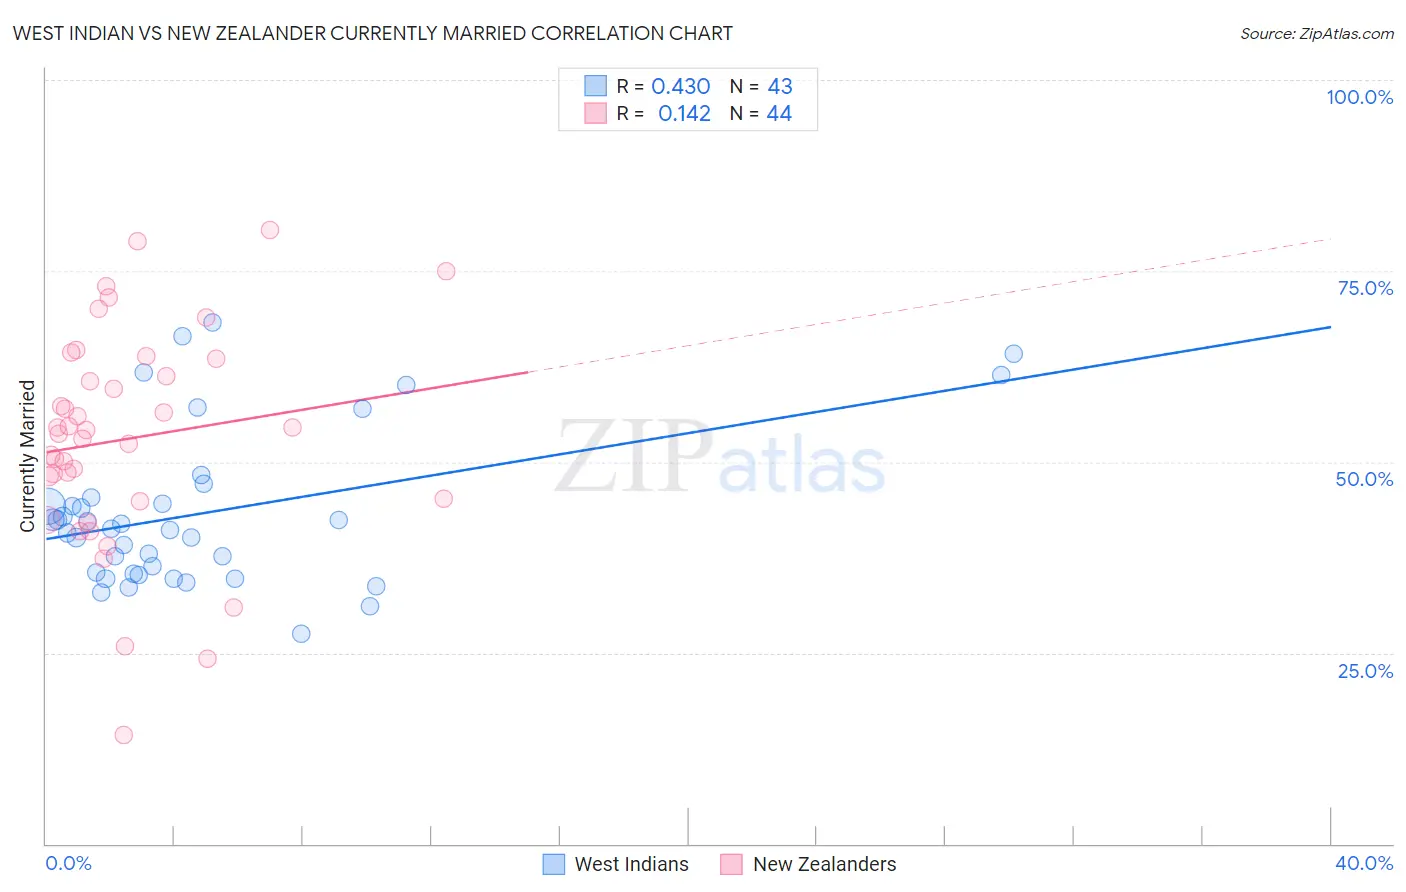
West Indian vs New Zealander Currently Married Correlation Chart
The statistical analysis conducted on geographies consisting of 254,034,527 people shows a moderate positive correlation between the proportion of West Indians and percentage of population currently married in the United States with a correlation coefficient (R) of 0.430 and weighted average of 41.3%. Similarly, the statistical analysis conducted on geographies consisting of 106,918,657 people shows a poor positive correlation between the proportion of New Zealanders and percentage of population currently married in the United States with a correlation coefficient (R) of 0.142 and weighted average of 47.4%, a difference of 14.6%.
Currently Married Correlation Summary
| Measurement | West Indian | New Zealander |
| Minimum | 27.5% | 14.3% |
| Maximum | 68.2% | 80.4% |
| Range | 40.7% | 66.1% |
| Mean | 43.3% | 53.0% |
| Median | 41.3% | 53.9% |
| Interquartile 25% (IQ1) | 35.3% | 45.0% |
| Interquartile 75% (IQ3) | 45.4% | 62.4% |
| Interquartile Range (IQR) | 10.0% | 17.4% |
| Standard Deviation (Sample) | 10.2% | 14.2% |
| Standard Deviation (Population) | 10.1% | 14.0% |
Similar Demographics by Currently Married
Demographics Similar to West Indians by Currently Married
In terms of currently married, the demographic groups most similar to West Indians are Jamaican (41.4%, a difference of 0.080%), Inupiat (41.3%, a difference of 0.090%), Immigrants from Caribbean (41.3%, a difference of 0.15%), Haitian (41.3%, a difference of 0.17%), and Bahamian (41.2%, a difference of 0.35%).
| Demographics | Rating | Rank | Currently Married |
| Africans | 0.0 /100 | #307 | Tragic 41.8% |
| Immigrants | Belize | 0.0 /100 | #308 | Tragic 41.8% |
| Immigrants | Liberia | 0.0 /100 | #309 | Tragic 41.8% |
| Guyanese | 0.0 /100 | #310 | Tragic 41.6% |
| Trinidadians and Tobagonians | 0.0 /100 | #311 | Tragic 41.5% |
| Somalis | 0.0 /100 | #312 | Tragic 41.5% |
| Jamaicans | 0.0 /100 | #313 | Tragic 41.4% |
| West Indians | 0.0 /100 | #314 | Tragic 41.3% |
| Inupiat | 0.0 /100 | #315 | Tragic 41.3% |
| Immigrants | Caribbean | 0.0 /100 | #316 | Tragic 41.3% |
| Haitians | 0.0 /100 | #317 | Tragic 41.3% |
| Bahamians | 0.0 /100 | #318 | Tragic 41.2% |
| Immigrants | Somalia | 0.0 /100 | #319 | Tragic 41.2% |
| Immigrants | Jamaica | 0.0 /100 | #320 | Tragic 41.1% |
| Immigrants | Congo | 0.0 /100 | #321 | Tragic 41.1% |
Demographics Similar to New Zealanders by Currently Married
In terms of currently married, the demographic groups most similar to New Zealanders are Immigrants from Jordan (47.4%, a difference of 0.0%), Okinawan (47.4%, a difference of 0.030%), Portuguese (47.3%, a difference of 0.040%), Sri Lankan (47.3%, a difference of 0.11%), and Laotian (47.4%, a difference of 0.13%).
| Demographics | Rating | Rank | Currently Married |
| Syrians | 88.9 /100 | #120 | Excellent 47.5% |
| Immigrants | Croatia | 88.6 /100 | #121 | Excellent 47.5% |
| Osage | 87.9 /100 | #122 | Excellent 47.5% |
| Immigrants | Kazakhstan | 87.2 /100 | #123 | Excellent 47.4% |
| Laotians | 86.6 /100 | #124 | Excellent 47.4% |
| Okinawans | 85.3 /100 | #125 | Excellent 47.4% |
| Immigrants | Jordan | 84.9 /100 | #126 | Excellent 47.4% |
| New Zealanders | 84.9 /100 | #127 | Excellent 47.4% |
| Portuguese | 84.2 /100 | #128 | Excellent 47.3% |
| Sri Lankans | 83.2 /100 | #129 | Excellent 47.3% |
| Immigrants | Iraq | 82.8 /100 | #130 | Excellent 47.3% |
| Icelanders | 82.4 /100 | #131 | Excellent 47.3% |
| Afghans | 81.8 /100 | #132 | Excellent 47.3% |
| Immigrants | Malaysia | 81.1 /100 | #133 | Excellent 47.3% |
| Immigrants | Australia | 81.1 /100 | #134 | Excellent 47.3% |