Immigrants from Malaysia vs New Zealander Currently Married
COMPARE
Immigrants from Malaysia
New Zealander
Currently Married
Currently Married Comparison
Immigrants from Malaysia
New Zealanders
47.3%
CURRENTLY MARRIED
81.1/ 100
METRIC RATING
133rd/ 347
METRIC RANK
47.4%
CURRENTLY MARRIED
84.9/ 100
METRIC RATING
127th/ 347
METRIC RANK
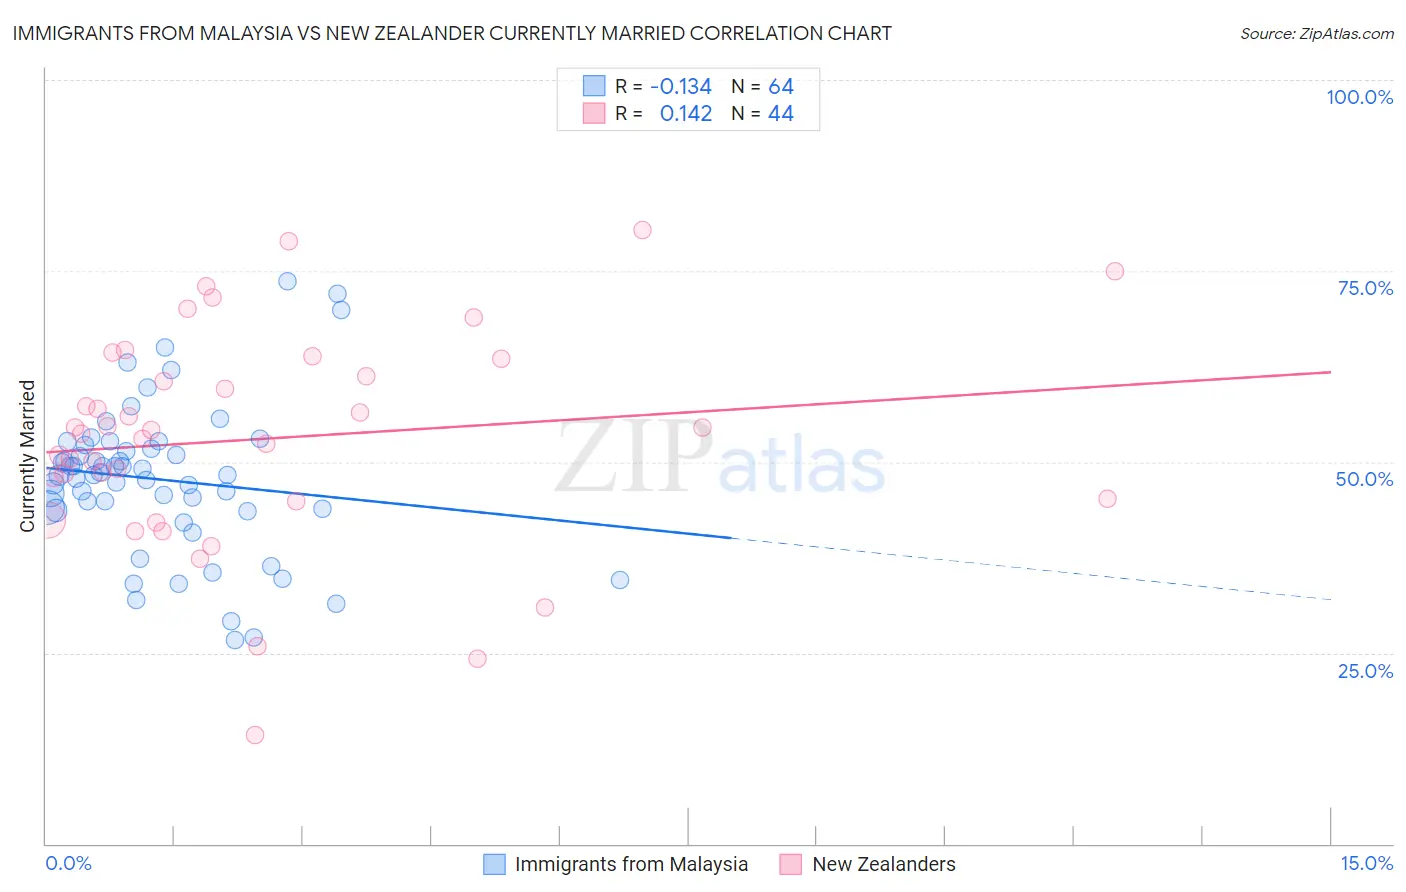
Immigrants from Malaysia vs New Zealander Currently Married Correlation Chart
The statistical analysis conducted on geographies consisting of 197,973,854 people shows a poor negative correlation between the proportion of Immigrants from Malaysia and percentage of population currently married in the United States with a correlation coefficient (R) of -0.134 and weighted average of 47.3%. Similarly, the statistical analysis conducted on geographies consisting of 106,918,657 people shows a poor positive correlation between the proportion of New Zealanders and percentage of population currently married in the United States with a correlation coefficient (R) of 0.142 and weighted average of 47.4%, a difference of 0.24%.
Currently Married Correlation Summary
| Measurement | Immigrants from Malaysia | New Zealander |
| Minimum | 26.6% | 14.3% |
| Maximum | 73.6% | 80.4% |
| Range | 47.0% | 66.1% |
| Mean | 47.7% | 53.0% |
| Median | 48.3% | 53.9% |
| Interquartile 25% (IQ1) | 43.8% | 45.0% |
| Interquartile 75% (IQ3) | 51.9% | 62.4% |
| Interquartile Range (IQR) | 8.2% | 17.4% |
| Standard Deviation (Sample) | 9.8% | 14.2% |
| Standard Deviation (Population) | 9.8% | 14.0% |
Demographics Similar to Immigrants from Malaysia and New Zealanders by Currently Married
In terms of currently married, the demographic groups most similar to Immigrants from Malaysia are Immigrants from Australia (47.3%, a difference of 0.0%), Afghan (47.3%, a difference of 0.040%), Icelander (47.3%, a difference of 0.080%), Immigrants from Norway (47.2%, a difference of 0.080%), and Immigrants from Iraq (47.3%, a difference of 0.10%). Similarly, the demographic groups most similar to New Zealanders are Immigrants from Jordan (47.4%, a difference of 0.0%), Okinawan (47.4%, a difference of 0.030%), Portuguese (47.3%, a difference of 0.040%), Sri Lankan (47.3%, a difference of 0.11%), and Laotian (47.4%, a difference of 0.13%).
| Demographics | Rating | Rank | Currently Married |
| Syrians | 88.9 /100 | #120 | Excellent 47.5% |
| Immigrants | Croatia | 88.6 /100 | #121 | Excellent 47.5% |
| Osage | 87.9 /100 | #122 | Excellent 47.5% |
| Immigrants | Kazakhstan | 87.2 /100 | #123 | Excellent 47.4% |
| Laotians | 86.6 /100 | #124 | Excellent 47.4% |
| Okinawans | 85.3 /100 | #125 | Excellent 47.4% |
| Immigrants | Jordan | 84.9 /100 | #126 | Excellent 47.4% |
| New Zealanders | 84.9 /100 | #127 | Excellent 47.4% |
| Portuguese | 84.2 /100 | #128 | Excellent 47.3% |
| Sri Lankans | 83.2 /100 | #129 | Excellent 47.3% |
| Immigrants | Iraq | 82.8 /100 | #130 | Excellent 47.3% |
| Icelanders | 82.4 /100 | #131 | Excellent 47.3% |
| Afghans | 81.8 /100 | #132 | Excellent 47.3% |
| Immigrants | Malaysia | 81.1 /100 | #133 | Excellent 47.3% |
| Immigrants | Australia | 81.1 /100 | #134 | Excellent 47.3% |
| Immigrants | Norway | 79.7 /100 | #135 | Good 47.2% |
| Immigrants | Vietnam | 78.2 /100 | #136 | Good 47.2% |
| Paraguayans | 77.8 /100 | #137 | Good 47.2% |
| Pakistanis | 77.5 /100 | #138 | Good 47.2% |
| Yugoslavians | 77.4 /100 | #139 | Good 47.2% |
| Cajuns | 75.3 /100 | #140 | Good 47.1% |