Iranian vs New Zealander Currently Married
COMPARE
Iranian
New Zealander
Currently Married
Currently Married Comparison
Iranians
New Zealanders
48.6%
CURRENTLY MARRIED
99.0/ 100
METRIC RATING
50th/ 347
METRIC RANK
47.4%
CURRENTLY MARRIED
84.9/ 100
METRIC RATING
127th/ 347
METRIC RANK
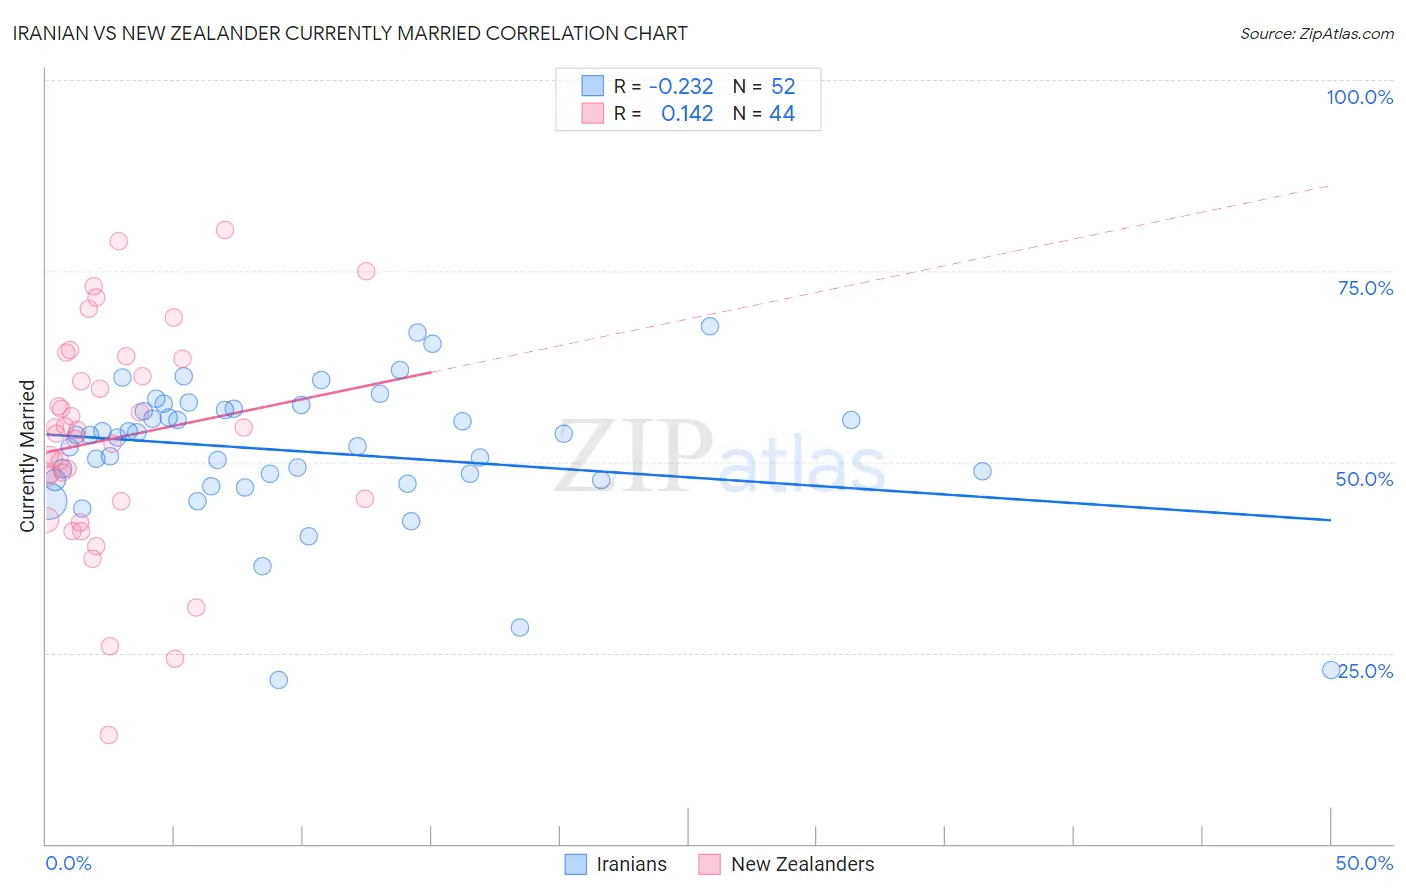
Iranian vs New Zealander Currently Married Correlation Chart
The statistical analysis conducted on geographies consisting of 316,855,418 people shows a weak negative correlation between the proportion of Iranians and percentage of population currently married in the United States with a correlation coefficient (R) of -0.232 and weighted average of 48.6%. Similarly, the statistical analysis conducted on geographies consisting of 106,918,657 people shows a poor positive correlation between the proportion of New Zealanders and percentage of population currently married in the United States with a correlation coefficient (R) of 0.142 and weighted average of 47.4%, a difference of 2.6%.
Currently Married Correlation Summary
| Measurement | Iranian | New Zealander |
| Minimum | 21.4% | 14.3% |
| Maximum | 67.8% | 80.4% |
| Range | 46.4% | 66.1% |
| Mean | 51.3% | 53.0% |
| Median | 53.3% | 53.9% |
| Interquartile 25% (IQ1) | 47.6% | 45.0% |
| Interquartile 75% (IQ3) | 56.9% | 62.4% |
| Interquartile Range (IQR) | 9.3% | 17.4% |
| Standard Deviation (Sample) | 9.4% | 14.2% |
| Standard Deviation (Population) | 9.3% | 14.0% |
Similar Demographics by Currently Married
Demographics Similar to Iranians by Currently Married
In terms of currently married, the demographic groups most similar to Iranians are White/Caucasian (48.6%, a difference of 0.010%), Bhutanese (48.6%, a difference of 0.060%), Russian (48.6%, a difference of 0.090%), Austrian (48.7%, a difference of 0.19%), and Immigrants from Iran (48.7%, a difference of 0.21%).
| Demographics | Rating | Rank | Currently Married |
| Scotch-Irish | 99.3 /100 | #43 | Exceptional 48.7% |
| Immigrants | North America | 99.3 /100 | #44 | Exceptional 48.7% |
| Belgians | 99.3 /100 | #45 | Exceptional 48.7% |
| Immigrants | Iran | 99.2 /100 | #46 | Exceptional 48.7% |
| Northern Europeans | 99.2 /100 | #47 | Exceptional 48.7% |
| Austrians | 99.2 /100 | #48 | Exceptional 48.7% |
| Bhutanese | 99.1 /100 | #49 | Exceptional 48.6% |
| Iranians | 99.0 /100 | #50 | Exceptional 48.6% |
| Whites/Caucasians | 99.0 /100 | #51 | Exceptional 48.6% |
| Russians | 98.9 /100 | #52 | Exceptional 48.6% |
| Immigrants | Austria | 98.8 /100 | #53 | Exceptional 48.5% |
| Immigrants | Moldova | 98.7 /100 | #54 | Exceptional 48.5% |
| Immigrants | North Macedonia | 98.7 /100 | #55 | Exceptional 48.5% |
| Latvians | 98.7 /100 | #56 | Exceptional 48.5% |
| Immigrants | Netherlands | 98.6 /100 | #57 | Exceptional 48.5% |
Demographics Similar to New Zealanders by Currently Married
In terms of currently married, the demographic groups most similar to New Zealanders are Immigrants from Jordan (47.4%, a difference of 0.0%), Okinawan (47.4%, a difference of 0.030%), Portuguese (47.3%, a difference of 0.040%), Sri Lankan (47.3%, a difference of 0.11%), and Laotian (47.4%, a difference of 0.13%).
| Demographics | Rating | Rank | Currently Married |
| Syrians | 88.9 /100 | #120 | Excellent 47.5% |
| Immigrants | Croatia | 88.6 /100 | #121 | Excellent 47.5% |
| Osage | 87.9 /100 | #122 | Excellent 47.5% |
| Immigrants | Kazakhstan | 87.2 /100 | #123 | Excellent 47.4% |
| Laotians | 86.6 /100 | #124 | Excellent 47.4% |
| Okinawans | 85.3 /100 | #125 | Excellent 47.4% |
| Immigrants | Jordan | 84.9 /100 | #126 | Excellent 47.4% |
| New Zealanders | 84.9 /100 | #127 | Excellent 47.4% |
| Portuguese | 84.2 /100 | #128 | Excellent 47.3% |
| Sri Lankans | 83.2 /100 | #129 | Excellent 47.3% |
| Immigrants | Iraq | 82.8 /100 | #130 | Excellent 47.3% |
| Icelanders | 82.4 /100 | #131 | Excellent 47.3% |
| Afghans | 81.8 /100 | #132 | Excellent 47.3% |
| Immigrants | Malaysia | 81.1 /100 | #133 | Excellent 47.3% |
| Immigrants | Australia | 81.1 /100 | #134 | Excellent 47.3% |