Crow vs Mongolian Births to Unmarried Women
COMPARE
Crow
Mongolian
Births to Unmarried Women
Births to Unmarried Women Comparison
Crow
Mongolians
40.4%
BIRTHS TO UNMARRIED WOMEN
0.0/ 100
METRIC RATING
320th/ 347
METRIC RANK
27.9%
BIRTHS TO UNMARRIED WOMEN
99.3/ 100
METRIC RATING
55th/ 347
METRIC RANK
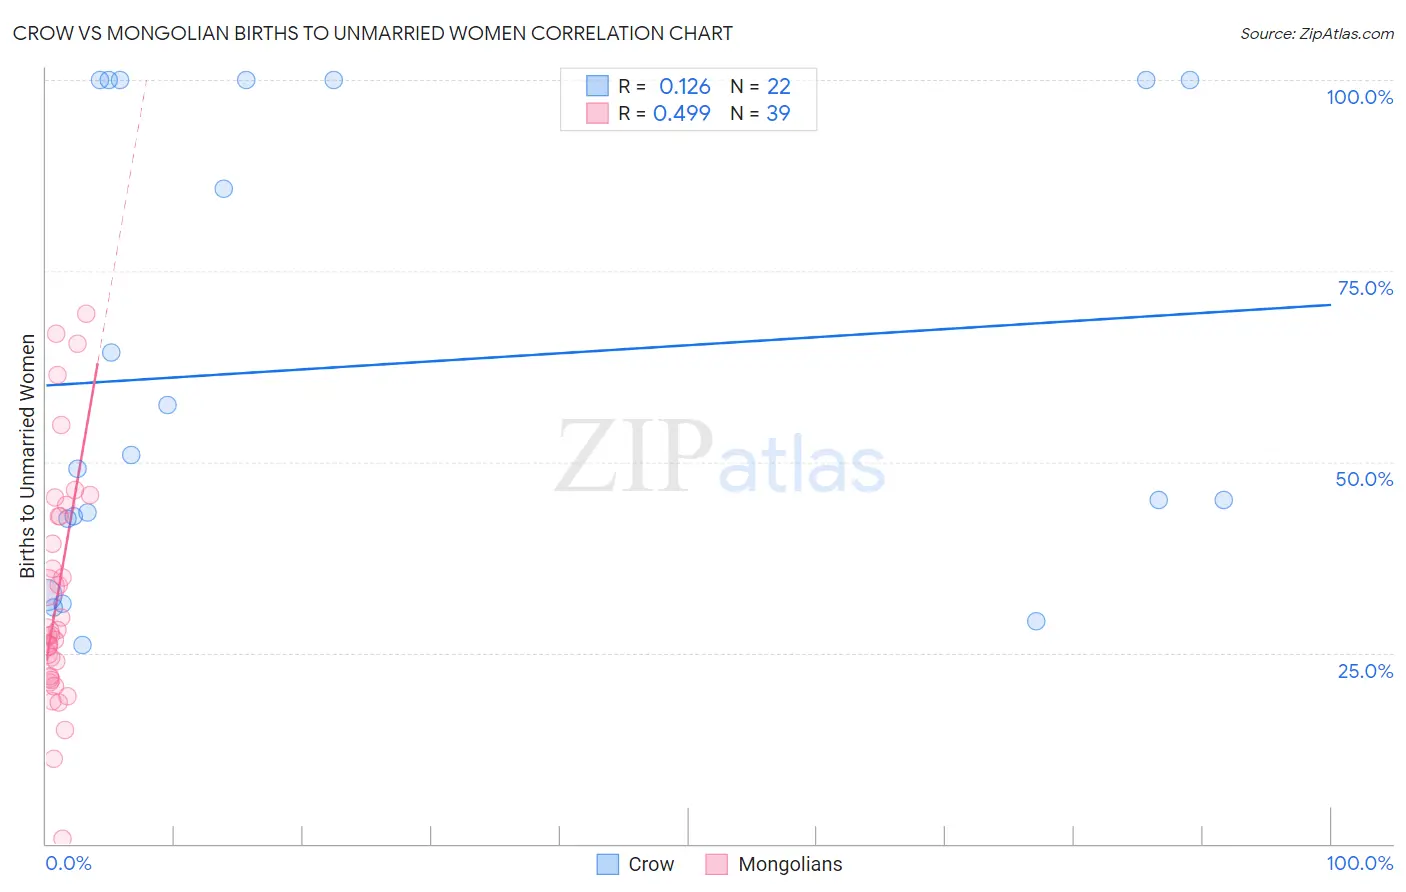
Crow vs Mongolian Births to Unmarried Women Correlation Chart
The statistical analysis conducted on geographies consisting of 58,263,233 people shows a poor positive correlation between the proportion of Crow and percentage of births to unmarried women in the United States with a correlation coefficient (R) of 0.126 and weighted average of 40.4%. Similarly, the statistical analysis conducted on geographies consisting of 135,823,191 people shows a moderate positive correlation between the proportion of Mongolians and percentage of births to unmarried women in the United States with a correlation coefficient (R) of 0.499 and weighted average of 27.9%, a difference of 44.6%.
Births to Unmarried Women Correlation Summary
| Measurement | Crow | Mongolian |
| Minimum | 26.1% | 0.60% |
| Maximum | 100.0% | 69.4% |
| Range | 73.9% | 68.8% |
| Mean | 62.6% | 32.6% |
| Median | 50.0% | 27.3% |
| Interquartile 25% (IQ1) | 42.5% | 21.7% |
| Interquartile 75% (IQ3) | 100.0% | 42.9% |
| Interquartile Range (IQR) | 57.5% | 21.2% |
| Standard Deviation (Sample) | 29.1% | 15.7% |
| Standard Deviation (Population) | 28.4% | 15.5% |
Similar Demographics by Births to Unmarried Women
Demographics Similar to Crow by Births to Unmarried Women
In terms of births to unmarried women, the demographic groups most similar to Crow are Yakama (40.3%, a difference of 0.060%), Immigrants from Bahamas (40.1%, a difference of 0.61%), Immigrants from Dominican Republic (40.1%, a difference of 0.68%), Bahamian (40.8%, a difference of 1.0%), and Apache (39.9%, a difference of 1.2%).
| Demographics | Rating | Rank | Births to Unmarried Women |
| Africans | 0.0 /100 | #313 | Tragic 39.7% |
| Immigrants | Caribbean | 0.0 /100 | #314 | Tragic 39.8% |
| Dominicans | 0.0 /100 | #315 | Tragic 39.8% |
| Apache | 0.0 /100 | #316 | Tragic 39.9% |
| Immigrants | Dominican Republic | 0.0 /100 | #317 | Tragic 40.1% |
| Immigrants | Bahamas | 0.0 /100 | #318 | Tragic 40.1% |
| Yakama | 0.0 /100 | #319 | Tragic 40.3% |
| Crow | 0.0 /100 | #320 | Tragic 40.4% |
| Bahamians | 0.0 /100 | #321 | Tragic 40.8% |
| Cajuns | 0.0 /100 | #322 | Tragic 41.0% |
| Sioux | 0.0 /100 | #323 | Tragic 41.0% |
| Cape Verdeans | 0.0 /100 | #324 | Tragic 41.3% |
| Cheyenne | 0.0 /100 | #325 | Tragic 41.3% |
| Immigrants | Cuba | 0.0 /100 | #326 | Tragic 41.5% |
| Tsimshian | 0.0 /100 | #327 | Tragic 42.2% |
Demographics Similar to Mongolians by Births to Unmarried Women
In terms of births to unmarried women, the demographic groups most similar to Mongolians are Afghan (27.9%, a difference of 0.040%), Immigrants from Romania (27.9%, a difference of 0.11%), Bhutanese (27.9%, a difference of 0.12%), Macedonian (27.9%, a difference of 0.16%), and Immigrants from Belgium (28.0%, a difference of 0.26%).
| Demographics | Rating | Rank | Births to Unmarried Women |
| Eastern Europeans | 99.5 /100 | #48 | Exceptional 27.7% |
| Immigrants | Greece | 99.4 /100 | #49 | Exceptional 27.8% |
| Maltese | 99.4 /100 | #50 | Exceptional 27.8% |
| Macedonians | 99.4 /100 | #51 | Exceptional 27.9% |
| Bhutanese | 99.4 /100 | #52 | Exceptional 27.9% |
| Immigrants | Romania | 99.4 /100 | #53 | Exceptional 27.9% |
| Afghans | 99.4 /100 | #54 | Exceptional 27.9% |
| Mongolians | 99.3 /100 | #55 | Exceptional 27.9% |
| Immigrants | Belgium | 99.3 /100 | #56 | Exceptional 28.0% |
| Russians | 99.2 /100 | #57 | Exceptional 28.0% |
| Immigrants | Albania | 99.2 /100 | #58 | Exceptional 28.0% |
| Immigrants | Kazakhstan | 99.1 /100 | #59 | Exceptional 28.1% |
| Immigrants | Turkey | 99.1 /100 | #60 | Exceptional 28.1% |
| Immigrants | North Macedonia | 99.1 /100 | #61 | Exceptional 28.1% |
| Egyptians | 99.0 /100 | #62 | Exceptional 28.2% |