Crow vs Chinese Hearing Disability
COMPARE
Crow
Chinese
Hearing Disability
Hearing Disability Comparison
Crow
Chinese
4.2%
HEARING DISABILITY
0.0/ 100
METRIC RATING
329th/ 347
METRIC RANK
3.7%
HEARING DISABILITY
0.0/ 100
METRIC RATING
289th/ 347
METRIC RANK
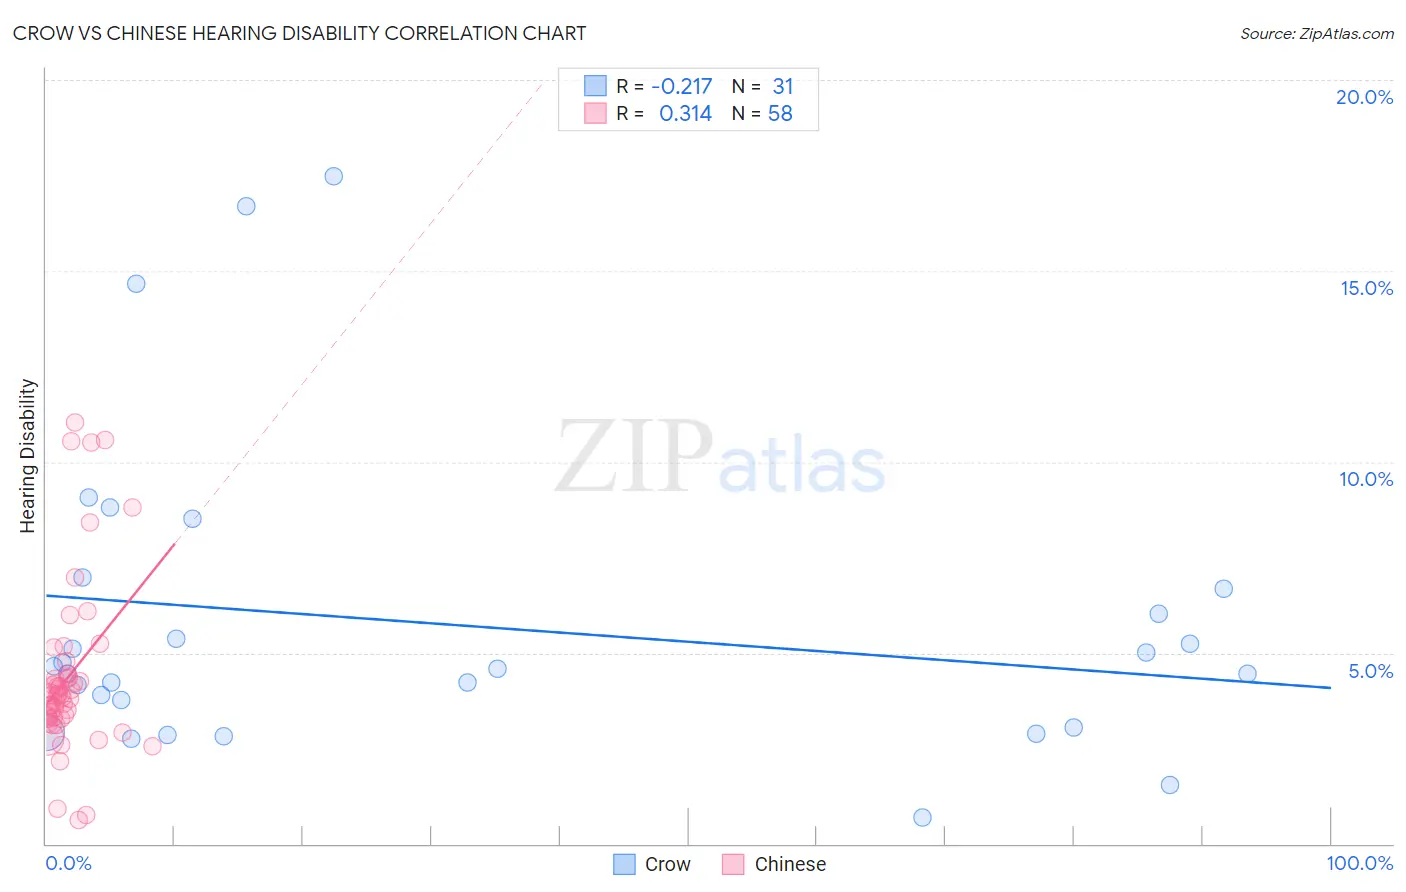
Crow vs Chinese Hearing Disability Correlation Chart
The statistical analysis conducted on geographies consisting of 59,194,968 people shows a weak negative correlation between the proportion of Crow and percentage of population with hearing disability in the United States with a correlation coefficient (R) of -0.217 and weighted average of 4.2%. Similarly, the statistical analysis conducted on geographies consisting of 64,801,631 people shows a mild positive correlation between the proportion of Chinese and percentage of population with hearing disability in the United States with a correlation coefficient (R) of 0.314 and weighted average of 3.7%, a difference of 13.2%.
Hearing Disability Correlation Summary
| Measurement | Crow | Chinese |
| Minimum | 0.69% | 0.63% |
| Maximum | 17.5% | 11.0% |
| Range | 16.8% | 10.4% |
| Mean | 5.7% | 4.4% |
| Median | 4.6% | 3.9% |
| Interquartile 25% (IQ1) | 3.1% | 3.3% |
| Interquartile 75% (IQ3) | 6.7% | 4.4% |
| Interquartile Range (IQR) | 3.6% | 1.1% |
| Standard Deviation (Sample) | 4.0% | 2.2% |
| Standard Deviation (Population) | 3.9% | 2.2% |
Similar Demographics by Hearing Disability
Demographics Similar to Crow by Hearing Disability
In terms of hearing disability, the demographic groups most similar to Crow are Tohono O'odham (4.2%, a difference of 0.010%), Arapaho (4.1%, a difference of 0.39%), Native/Alaskan (4.2%, a difference of 0.79%), Cherokee (4.2%, a difference of 0.94%), and Potawatomi (4.1%, a difference of 1.1%).
| Demographics | Rating | Rank | Hearing Disability |
| Seminole | 0.0 /100 | #322 | Tragic 4.1% |
| Apache | 0.0 /100 | #323 | Tragic 4.1% |
| Osage | 0.0 /100 | #324 | Tragic 4.1% |
| Lumbee | 0.0 /100 | #325 | Tragic 4.1% |
| Potawatomi | 0.0 /100 | #326 | Tragic 4.1% |
| Arapaho | 0.0 /100 | #327 | Tragic 4.1% |
| Tohono O'odham | 0.0 /100 | #328 | Tragic 4.2% |
| Crow | 0.0 /100 | #329 | Tragic 4.2% |
| Natives/Alaskans | 0.0 /100 | #330 | Tragic 4.2% |
| Cherokee | 0.0 /100 | #331 | Tragic 4.2% |
| Houma | 0.0 /100 | #332 | Tragic 4.2% |
| Dutch West Indians | 0.0 /100 | #333 | Tragic 4.3% |
| Aleuts | 0.0 /100 | #334 | Tragic 4.3% |
| Kiowa | 0.0 /100 | #335 | Tragic 4.3% |
| Creek | 0.0 /100 | #336 | Tragic 4.4% |
Demographics Similar to Chinese by Hearing Disability
In terms of hearing disability, the demographic groups most similar to Chinese are White/Caucasian (3.7%, a difference of 0.13%), Finnish (3.7%, a difference of 0.15%), Irish (3.7%, a difference of 0.21%), Native Hawaiian (3.7%, a difference of 0.21%), and Norwegian (3.7%, a difference of 0.27%).
| Demographics | Rating | Rank | Hearing Disability |
| Swedes | 0.0 /100 | #282 | Tragic 3.6% |
| Blackfeet | 0.0 /100 | #283 | Tragic 3.6% |
| Immigrants | Micronesia | 0.0 /100 | #284 | Tragic 3.6% |
| Sioux | 0.0 /100 | #285 | Tragic 3.6% |
| Delaware | 0.0 /100 | #286 | Tragic 3.6% |
| Spanish | 0.0 /100 | #287 | Tragic 3.7% |
| Irish | 0.0 /100 | #288 | Tragic 3.7% |
| Chinese | 0.0 /100 | #289 | Tragic 3.7% |
| Whites/Caucasians | 0.0 /100 | #290 | Tragic 3.7% |
| Finns | 0.0 /100 | #291 | Tragic 3.7% |
| Native Hawaiians | 0.0 /100 | #292 | Tragic 3.7% |
| Norwegians | 0.0 /100 | #293 | Tragic 3.7% |
| Iroquois | 0.0 /100 | #294 | Tragic 3.7% |
| Welsh | 0.0 /100 | #295 | Tragic 3.7% |
| Pima | 0.0 /100 | #296 | Tragic 3.7% |