Crow vs Moroccan Births to Unmarried Women
COMPARE
Crow
Moroccan
Births to Unmarried Women
Births to Unmarried Women Comparison
Crow
Moroccans
40.4%
BIRTHS TO UNMARRIED WOMEN
0.0/ 100
METRIC RATING
320th/ 347
METRIC RANK
31.8%
BIRTHS TO UNMARRIED WOMEN
45.7/ 100
METRIC RATING
180th/ 347
METRIC RANK
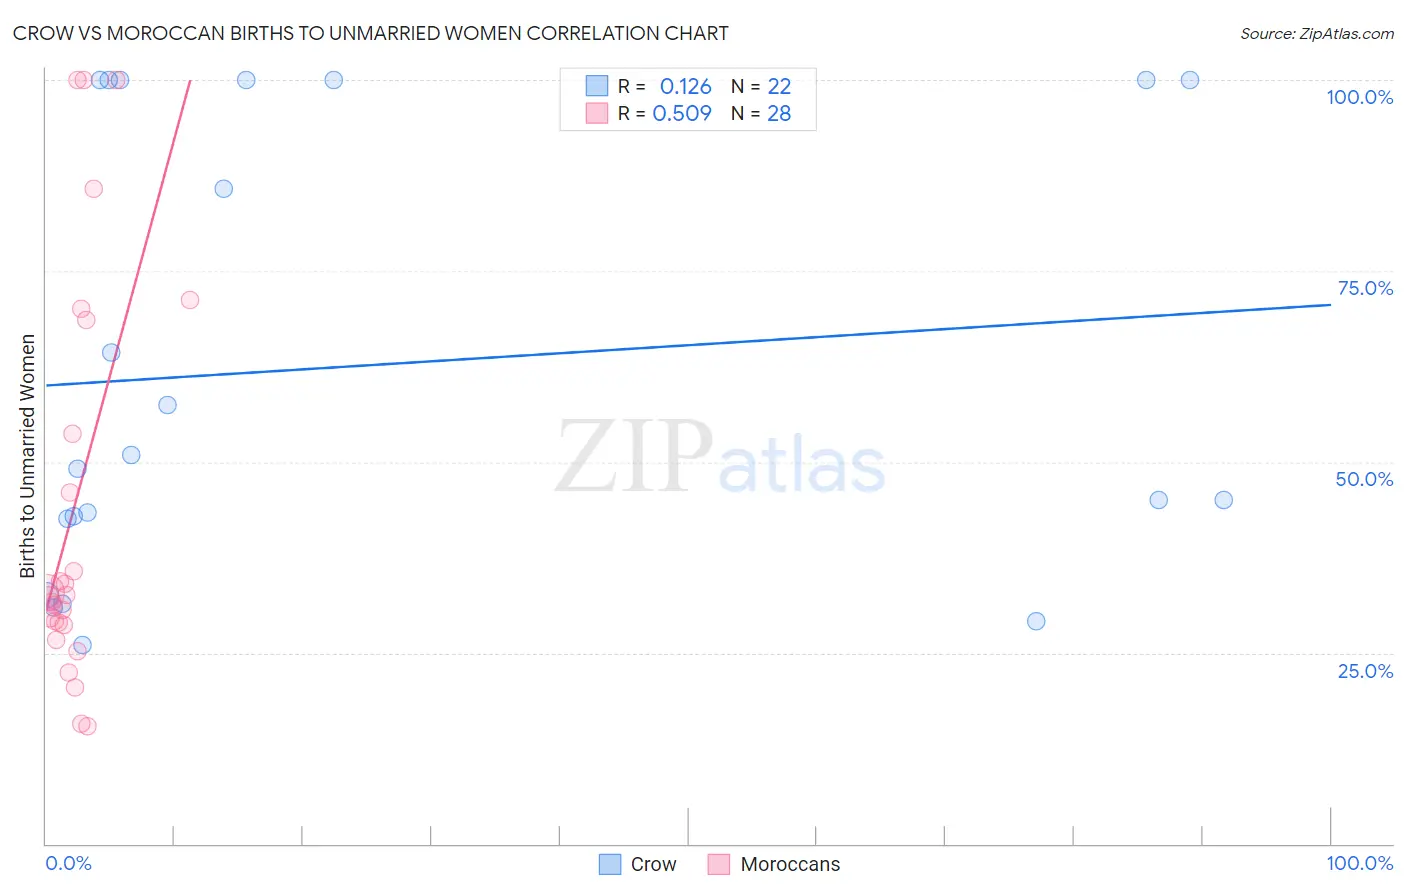
Crow vs Moroccan Births to Unmarried Women Correlation Chart
The statistical analysis conducted on geographies consisting of 58,263,233 people shows a poor positive correlation between the proportion of Crow and percentage of births to unmarried women in the United States with a correlation coefficient (R) of 0.126 and weighted average of 40.4%. Similarly, the statistical analysis conducted on geographies consisting of 194,487,713 people shows a substantial positive correlation between the proportion of Moroccans and percentage of births to unmarried women in the United States with a correlation coefficient (R) of 0.509 and weighted average of 31.8%, a difference of 26.9%.
Births to Unmarried Women Correlation Summary
| Measurement | Crow | Moroccan |
| Minimum | 26.1% | 15.3% |
| Maximum | 100.0% | 100.0% |
| Range | 73.9% | 84.7% |
| Mean | 62.6% | 44.0% |
| Median | 50.0% | 32.4% |
| Interquartile 25% (IQ1) | 42.5% | 28.8% |
| Interquartile 75% (IQ3) | 100.0% | 61.1% |
| Interquartile Range (IQR) | 57.5% | 32.3% |
| Standard Deviation (Sample) | 29.1% | 26.2% |
| Standard Deviation (Population) | 28.4% | 25.8% |
Similar Demographics by Births to Unmarried Women
Demographics Similar to Crow by Births to Unmarried Women
In terms of births to unmarried women, the demographic groups most similar to Crow are Yakama (40.3%, a difference of 0.060%), Immigrants from Bahamas (40.1%, a difference of 0.61%), Immigrants from Dominican Republic (40.1%, a difference of 0.68%), Bahamian (40.8%, a difference of 1.0%), and Apache (39.9%, a difference of 1.2%).
| Demographics | Rating | Rank | Births to Unmarried Women |
| Africans | 0.0 /100 | #313 | Tragic 39.7% |
| Immigrants | Caribbean | 0.0 /100 | #314 | Tragic 39.8% |
| Dominicans | 0.0 /100 | #315 | Tragic 39.8% |
| Apache | 0.0 /100 | #316 | Tragic 39.9% |
| Immigrants | Dominican Republic | 0.0 /100 | #317 | Tragic 40.1% |
| Immigrants | Bahamas | 0.0 /100 | #318 | Tragic 40.1% |
| Yakama | 0.0 /100 | #319 | Tragic 40.3% |
| Crow | 0.0 /100 | #320 | Tragic 40.4% |
| Bahamians | 0.0 /100 | #321 | Tragic 40.8% |
| Cajuns | 0.0 /100 | #322 | Tragic 41.0% |
| Sioux | 0.0 /100 | #323 | Tragic 41.0% |
| Cape Verdeans | 0.0 /100 | #324 | Tragic 41.3% |
| Cheyenne | 0.0 /100 | #325 | Tragic 41.3% |
| Immigrants | Cuba | 0.0 /100 | #326 | Tragic 41.5% |
| Tsimshian | 0.0 /100 | #327 | Tragic 42.2% |
Demographics Similar to Moroccans by Births to Unmarried Women
In terms of births to unmarried women, the demographic groups most similar to Moroccans are Immigrants from Peru (31.8%, a difference of 0.060%), South American (31.8%, a difference of 0.11%), English (31.7%, a difference of 0.15%), South American Indian (31.7%, a difference of 0.18%), and Scottish (31.7%, a difference of 0.22%).
| Demographics | Rating | Rank | Births to Unmarried Women |
| Immigrants | Yemen | 50.2 /100 | #173 | Average 31.7% |
| Venezuelans | 50.0 /100 | #174 | Average 31.7% |
| Immigrants | Venezuela | 49.2 /100 | #175 | Average 31.7% |
| Scottish | 48.1 /100 | #176 | Average 31.7% |
| South American Indians | 47.7 /100 | #177 | Average 31.7% |
| English | 47.4 /100 | #178 | Average 31.7% |
| South Americans | 46.9 /100 | #179 | Average 31.8% |
| Moroccans | 45.7 /100 | #180 | Average 31.8% |
| Immigrants | Peru | 45.1 /100 | #181 | Average 31.8% |
| Kenyans | 43.0 /100 | #182 | Average 31.9% |
| Canadians | 41.4 /100 | #183 | Average 31.9% |
| Immigrants | South America | 40.7 /100 | #184 | Average 32.0% |
| Germans | 39.5 /100 | #185 | Fair 32.0% |
| Welsh | 38.2 /100 | #186 | Fair 32.0% |
| Czechoslovakians | 38.0 /100 | #187 | Fair 32.0% |