Crow vs Pennsylvania German Births to Unmarried Women
COMPARE
Crow
Pennsylvania German
Births to Unmarried Women
Births to Unmarried Women Comparison
Crow
Pennsylvania Germans
40.4%
BIRTHS TO UNMARRIED WOMEN
0.0/ 100
METRIC RATING
320th/ 347
METRIC RANK
34.0%
BIRTHS TO UNMARRIED WOMEN
4.3/ 100
METRIC RATING
223rd/ 347
METRIC RANK
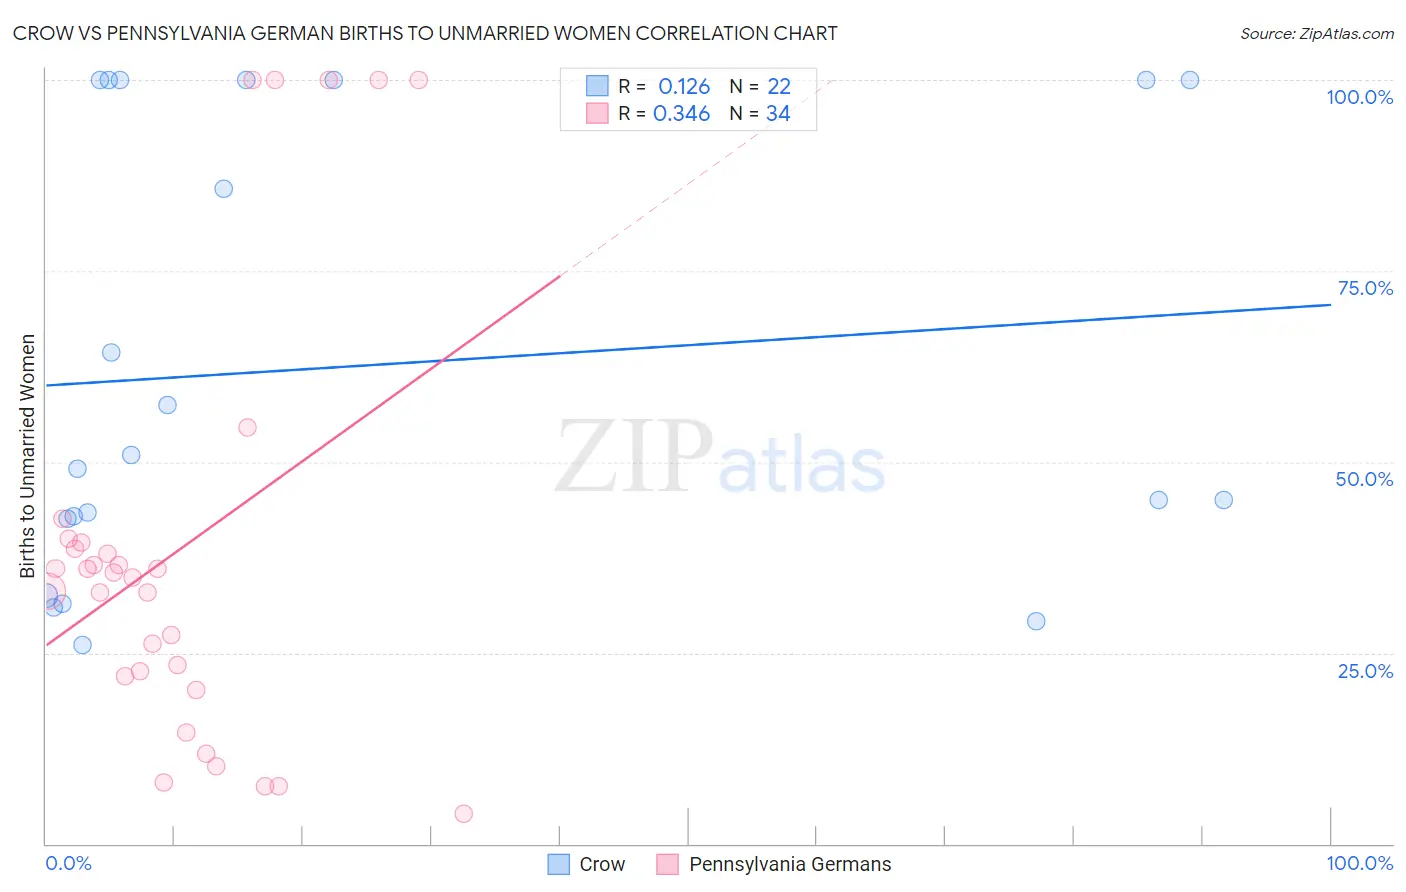
Crow vs Pennsylvania German Births to Unmarried Women Correlation Chart
The statistical analysis conducted on geographies consisting of 58,263,233 people shows a poor positive correlation between the proportion of Crow and percentage of births to unmarried women in the United States with a correlation coefficient (R) of 0.126 and weighted average of 40.4%. Similarly, the statistical analysis conducted on geographies consisting of 220,469,063 people shows a mild positive correlation between the proportion of Pennsylvania Germans and percentage of births to unmarried women in the United States with a correlation coefficient (R) of 0.346 and weighted average of 34.0%, a difference of 18.7%.
Births to Unmarried Women Correlation Summary
| Measurement | Crow | Pennsylvania German |
| Minimum | 26.1% | 4.0% |
| Maximum | 100.0% | 100.0% |
| Range | 73.9% | 96.0% |
| Mean | 62.6% | 38.5% |
| Median | 50.0% | 35.2% |
| Interquartile 25% (IQ1) | 42.5% | 21.9% |
| Interquartile 75% (IQ3) | 100.0% | 39.5% |
| Interquartile Range (IQR) | 57.5% | 17.6% |
| Standard Deviation (Sample) | 29.1% | 28.5% |
| Standard Deviation (Population) | 28.4% | 28.1% |
Similar Demographics by Births to Unmarried Women
Demographics Similar to Crow by Births to Unmarried Women
In terms of births to unmarried women, the demographic groups most similar to Crow are Yakama (40.3%, a difference of 0.060%), Immigrants from Bahamas (40.1%, a difference of 0.61%), Immigrants from Dominican Republic (40.1%, a difference of 0.68%), Bahamian (40.8%, a difference of 1.0%), and Apache (39.9%, a difference of 1.2%).
| Demographics | Rating | Rank | Births to Unmarried Women |
| Africans | 0.0 /100 | #313 | Tragic 39.7% |
| Immigrants | Caribbean | 0.0 /100 | #314 | Tragic 39.8% |
| Dominicans | 0.0 /100 | #315 | Tragic 39.8% |
| Apache | 0.0 /100 | #316 | Tragic 39.9% |
| Immigrants | Dominican Republic | 0.0 /100 | #317 | Tragic 40.1% |
| Immigrants | Bahamas | 0.0 /100 | #318 | Tragic 40.1% |
| Yakama | 0.0 /100 | #319 | Tragic 40.3% |
| Crow | 0.0 /100 | #320 | Tragic 40.4% |
| Bahamians | 0.0 /100 | #321 | Tragic 40.8% |
| Cajuns | 0.0 /100 | #322 | Tragic 41.0% |
| Sioux | 0.0 /100 | #323 | Tragic 41.0% |
| Cape Verdeans | 0.0 /100 | #324 | Tragic 41.3% |
| Cheyenne | 0.0 /100 | #325 | Tragic 41.3% |
| Immigrants | Cuba | 0.0 /100 | #326 | Tragic 41.5% |
| Tsimshian | 0.0 /100 | #327 | Tragic 42.2% |
Demographics Similar to Pennsylvania Germans by Births to Unmarried Women
In terms of births to unmarried women, the demographic groups most similar to Pennsylvania Germans are Immigrants from Laos (34.0%, a difference of 0.0%), Spanish (34.1%, a difference of 0.17%), Immigrants from Uruguay (33.9%, a difference of 0.29%), Malaysian (33.9%, a difference of 0.35%), and Portuguese (33.8%, a difference of 0.53%).
| Demographics | Rating | Rank | Births to Unmarried Women |
| Nepalese | 7.8 /100 | #216 | Tragic 33.5% |
| Spaniards | 7.0 /100 | #217 | Tragic 33.6% |
| Immigrants | Ecuador | 5.9 /100 | #218 | Tragic 33.7% |
| Alsatians | 5.4 /100 | #219 | Tragic 33.8% |
| Portuguese | 5.4 /100 | #220 | Tragic 33.8% |
| Malaysians | 5.0 /100 | #221 | Tragic 33.9% |
| Immigrants | Uruguay | 4.8 /100 | #222 | Tragic 33.9% |
| Pennsylvania Germans | 4.3 /100 | #223 | Tragic 34.0% |
| Immigrants | Laos | 4.3 /100 | #224 | Tragic 34.0% |
| Spanish | 4.0 /100 | #225 | Tragic 34.1% |
| Delaware | 3.3 /100 | #226 | Tragic 34.2% |
| Immigrants | Panama | 3.3 /100 | #227 | Tragic 34.2% |
| Panamanians | 3.3 /100 | #228 | Tragic 34.2% |
| Immigrants | Sierra Leone | 3.1 /100 | #229 | Tragic 34.2% |
| Ghanaians | 3.1 /100 | #230 | Tragic 34.3% |