Australian vs Scandinavian Births to Unmarried Women
COMPARE
Australian
Scandinavian
Births to Unmarried Women
Births to Unmarried Women Comparison
Australians
Scandinavians
29.5%
BIRTHS TO UNMARRIED WOMEN
94.6/ 100
METRIC RATING
102nd/ 347
METRIC RANK
29.8%
BIRTHS TO UNMARRIED WOMEN
92.7/ 100
METRIC RATING
113th/ 347
METRIC RANK
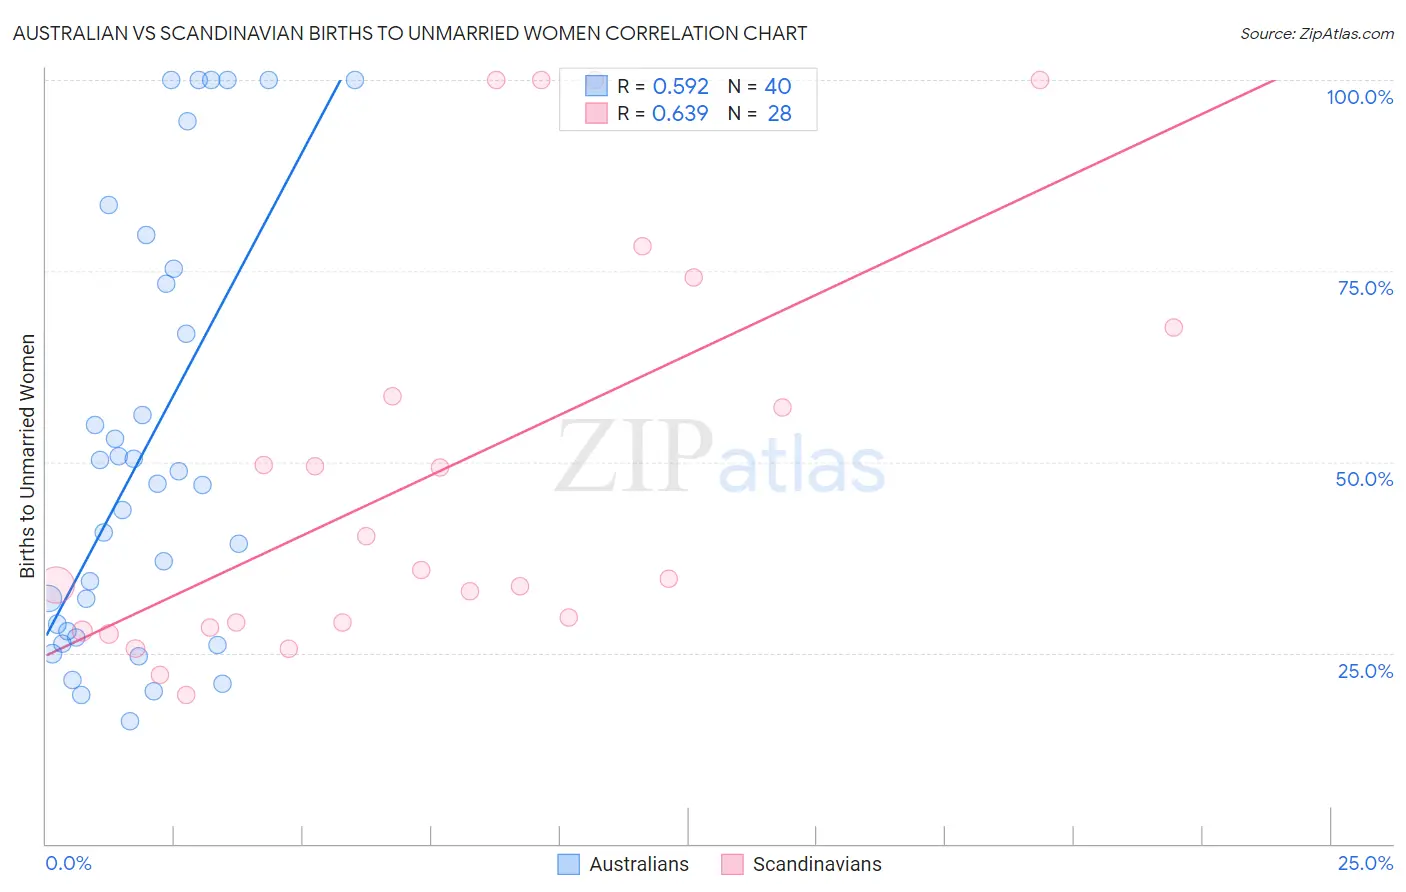
Australian vs Scandinavian Births to Unmarried Women Correlation Chart
The statistical analysis conducted on geographies consisting of 212,996,225 people shows a substantial positive correlation between the proportion of Australians and percentage of births to unmarried women in the United States with a correlation coefficient (R) of 0.592 and weighted average of 29.5%. Similarly, the statistical analysis conducted on geographies consisting of 430,139,153 people shows a significant positive correlation between the proportion of Scandinavians and percentage of births to unmarried women in the United States with a correlation coefficient (R) of 0.639 and weighted average of 29.8%, a difference of 0.78%.
Births to Unmarried Women Correlation Summary
| Measurement | Australian | Scandinavian |
| Minimum | 16.0% | 19.6% |
| Maximum | 100.0% | 100.0% |
| Range | 84.0% | 80.4% |
| Mean | 51.9% | 48.5% |
| Median | 47.1% | 35.3% |
| Interquartile 25% (IQ1) | 27.4% | 28.6% |
| Interquartile 75% (IQ3) | 74.3% | 63.0% |
| Interquartile Range (IQR) | 46.9% | 34.4% |
| Standard Deviation (Sample) | 27.9% | 26.4% |
| Standard Deviation (Population) | 27.5% | 25.9% |
Demographics Similar to Australians and Scandinavians by Births to Unmarried Women
In terms of births to unmarried women, the demographic groups most similar to Australians are Lebanese (29.5%, a difference of 0.050%), Lithuanian (29.6%, a difference of 0.060%), Immigrants from Northern Africa (29.5%, a difference of 0.080%), Immigrants from Nepal (29.6%, a difference of 0.11%), and Immigrants from Denmark (29.4%, a difference of 0.37%). Similarly, the demographic groups most similar to Scandinavians are Immigrants from Croatia (29.8%, a difference of 0.060%), Basque (29.7%, a difference of 0.10%), Immigrants from Hungary (29.7%, a difference of 0.11%), Immigrants from Ethiopia (29.7%, a difference of 0.25%), and Greek (29.7%, a difference of 0.28%).
| Demographics | Rating | Rank | Births to Unmarried Women |
| Immigrants | South Africa | 95.7 /100 | #97 | Exceptional 29.3% |
| Immigrants | Syria | 95.7 /100 | #98 | Exceptional 29.4% |
| Immigrants | Denmark | 95.3 /100 | #99 | Exceptional 29.4% |
| Luxembourgers | 95.2 /100 | #100 | Exceptional 29.4% |
| Immigrants | Northern Africa | 94.7 /100 | #101 | Exceptional 29.5% |
| Australians | 94.6 /100 | #102 | Exceptional 29.5% |
| Lebanese | 94.4 /100 | #103 | Exceptional 29.5% |
| Lithuanians | 94.4 /100 | #104 | Exceptional 29.6% |
| Immigrants | Nepal | 94.3 /100 | #105 | Exceptional 29.6% |
| Swedes | 93.8 /100 | #106 | Exceptional 29.6% |
| Immigrants | Brazil | 93.7 /100 | #107 | Exceptional 29.6% |
| Paraguayans | 93.5 /100 | #108 | Exceptional 29.7% |
| Greeks | 93.4 /100 | #109 | Exceptional 29.7% |
| Immigrants | Ethiopia | 93.4 /100 | #110 | Exceptional 29.7% |
| Immigrants | Hungary | 93.0 /100 | #111 | Exceptional 29.7% |
| Basques | 93.0 /100 | #112 | Exceptional 29.7% |
| Scandinavians | 92.7 /100 | #113 | Exceptional 29.8% |
| Immigrants | Croatia | 92.6 /100 | #114 | Exceptional 29.8% |
| Ethiopians | 91.9 /100 | #115 | Exceptional 29.8% |
| Immigrants | Italy | 91.7 /100 | #116 | Exceptional 29.9% |
| Immigrants | Netherlands | 91.1 /100 | #117 | Exceptional 29.9% |