Czechoslovakian vs Scandinavian Births to Unmarried Women
COMPARE
Czechoslovakian
Scandinavian
Births to Unmarried Women
Births to Unmarried Women Comparison
Czechoslovakians
Scandinavians
32.0%
BIRTHS TO UNMARRIED WOMEN
38.0/ 100
METRIC RATING
187th/ 347
METRIC RANK
29.8%
BIRTHS TO UNMARRIED WOMEN
92.7/ 100
METRIC RATING
113th/ 347
METRIC RANK
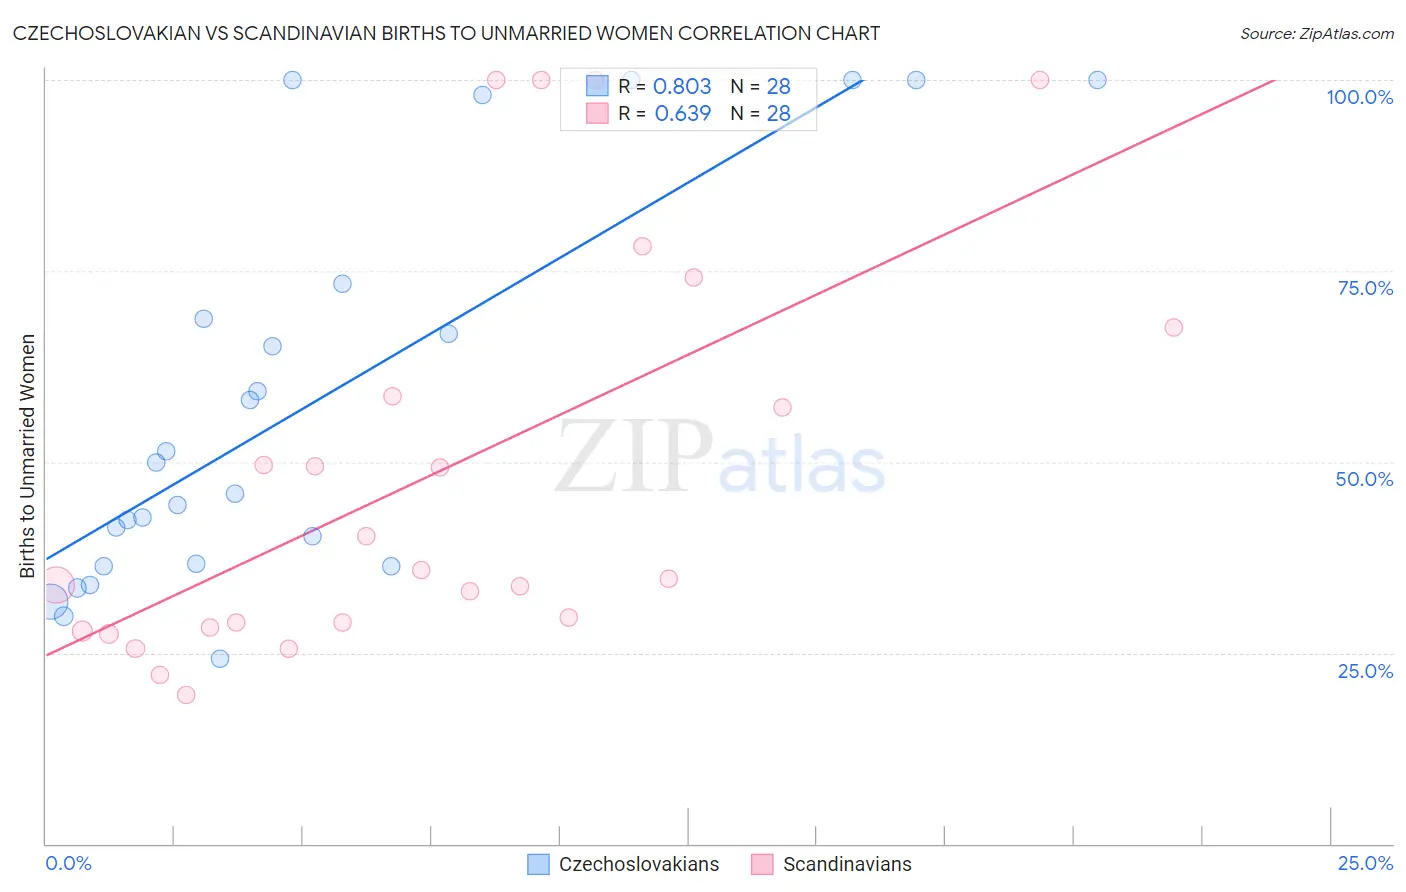
Czechoslovakian vs Scandinavian Births to Unmarried Women Correlation Chart
The statistical analysis conducted on geographies consisting of 341,149,563 people shows a very strong positive correlation between the proportion of Czechoslovakians and percentage of births to unmarried women in the United States with a correlation coefficient (R) of 0.803 and weighted average of 32.0%. Similarly, the statistical analysis conducted on geographies consisting of 430,139,153 people shows a significant positive correlation between the proportion of Scandinavians and percentage of births to unmarried women in the United States with a correlation coefficient (R) of 0.639 and weighted average of 29.8%, a difference of 7.6%.
Births to Unmarried Women Correlation Summary
| Measurement | Czechoslovakian | Scandinavian |
| Minimum | 24.3% | 19.6% |
| Maximum | 100.0% | 100.0% |
| Range | 75.7% | 80.4% |
| Mean | 57.5% | 48.5% |
| Median | 47.9% | 35.3% |
| Interquartile 25% (IQ1) | 36.5% | 28.6% |
| Interquartile 75% (IQ3) | 71.0% | 63.0% |
| Interquartile Range (IQR) | 34.5% | 34.4% |
| Standard Deviation (Sample) | 25.5% | 26.4% |
| Standard Deviation (Population) | 25.1% | 25.9% |
Similar Demographics by Births to Unmarried Women
Demographics Similar to Czechoslovakians by Births to Unmarried Women
In terms of births to unmarried women, the demographic groups most similar to Czechoslovakians are Welsh (32.0%, a difference of 0.020%), Osage (32.1%, a difference of 0.090%), Immigrants from Kenya (32.1%, a difference of 0.11%), German (32.0%, a difference of 0.15%), and Immigrants from South America (32.0%, a difference of 0.26%).
| Demographics | Rating | Rank | Births to Unmarried Women |
| Moroccans | 45.7 /100 | #180 | Average 31.8% |
| Immigrants | Peru | 45.1 /100 | #181 | Average 31.8% |
| Kenyans | 43.0 /100 | #182 | Average 31.9% |
| Canadians | 41.4 /100 | #183 | Average 31.9% |
| Immigrants | South America | 40.7 /100 | #184 | Average 32.0% |
| Germans | 39.5 /100 | #185 | Fair 32.0% |
| Welsh | 38.2 /100 | #186 | Fair 32.0% |
| Czechoslovakians | 38.0 /100 | #187 | Fair 32.0% |
| Osage | 37.1 /100 | #188 | Fair 32.1% |
| Immigrants | Kenya | 36.9 /100 | #189 | Fair 32.1% |
| Tlingit-Haida | 32.6 /100 | #190 | Fair 32.2% |
| Irish | 32.4 /100 | #191 | Fair 32.2% |
| Colombians | 31.9 /100 | #192 | Fair 32.2% |
| Fijians | 31.1 /100 | #193 | Fair 32.3% |
| Sudanese | 27.3 /100 | #194 | Fair 32.4% |
Demographics Similar to Scandinavians by Births to Unmarried Women
In terms of births to unmarried women, the demographic groups most similar to Scandinavians are Immigrants from Croatia (29.8%, a difference of 0.060%), Basque (29.7%, a difference of 0.10%), Immigrants from Hungary (29.7%, a difference of 0.11%), Immigrants from Ethiopia (29.7%, a difference of 0.25%), and Greek (29.7%, a difference of 0.28%).
| Demographics | Rating | Rank | Births to Unmarried Women |
| Swedes | 93.8 /100 | #106 | Exceptional 29.6% |
| Immigrants | Brazil | 93.7 /100 | #107 | Exceptional 29.6% |
| Paraguayans | 93.5 /100 | #108 | Exceptional 29.7% |
| Greeks | 93.4 /100 | #109 | Exceptional 29.7% |
| Immigrants | Ethiopia | 93.4 /100 | #110 | Exceptional 29.7% |
| Immigrants | Hungary | 93.0 /100 | #111 | Exceptional 29.7% |
| Basques | 93.0 /100 | #112 | Exceptional 29.7% |
| Scandinavians | 92.7 /100 | #113 | Exceptional 29.8% |
| Immigrants | Croatia | 92.6 /100 | #114 | Exceptional 29.8% |
| Ethiopians | 91.9 /100 | #115 | Exceptional 29.8% |
| Immigrants | Italy | 91.7 /100 | #116 | Exceptional 29.9% |
| Immigrants | Netherlands | 91.1 /100 | #117 | Exceptional 29.9% |
| Immigrants | Norway | 91.0 /100 | #118 | Exceptional 29.9% |
| Argentineans | 90.5 /100 | #119 | Exceptional 30.0% |
| Ugandans | 89.2 /100 | #120 | Excellent 30.1% |