Immigrants from Belarus vs Scandinavian Births to Unmarried Women
COMPARE
Immigrants from Belarus
Scandinavian
Births to Unmarried Women
Births to Unmarried Women Comparison
Immigrants from Belarus
Scandinavians
25.6%
BIRTHS TO UNMARRIED WOMEN
100.0/ 100
METRIC RATING
16th/ 347
METRIC RANK
29.8%
BIRTHS TO UNMARRIED WOMEN
92.7/ 100
METRIC RATING
113th/ 347
METRIC RANK
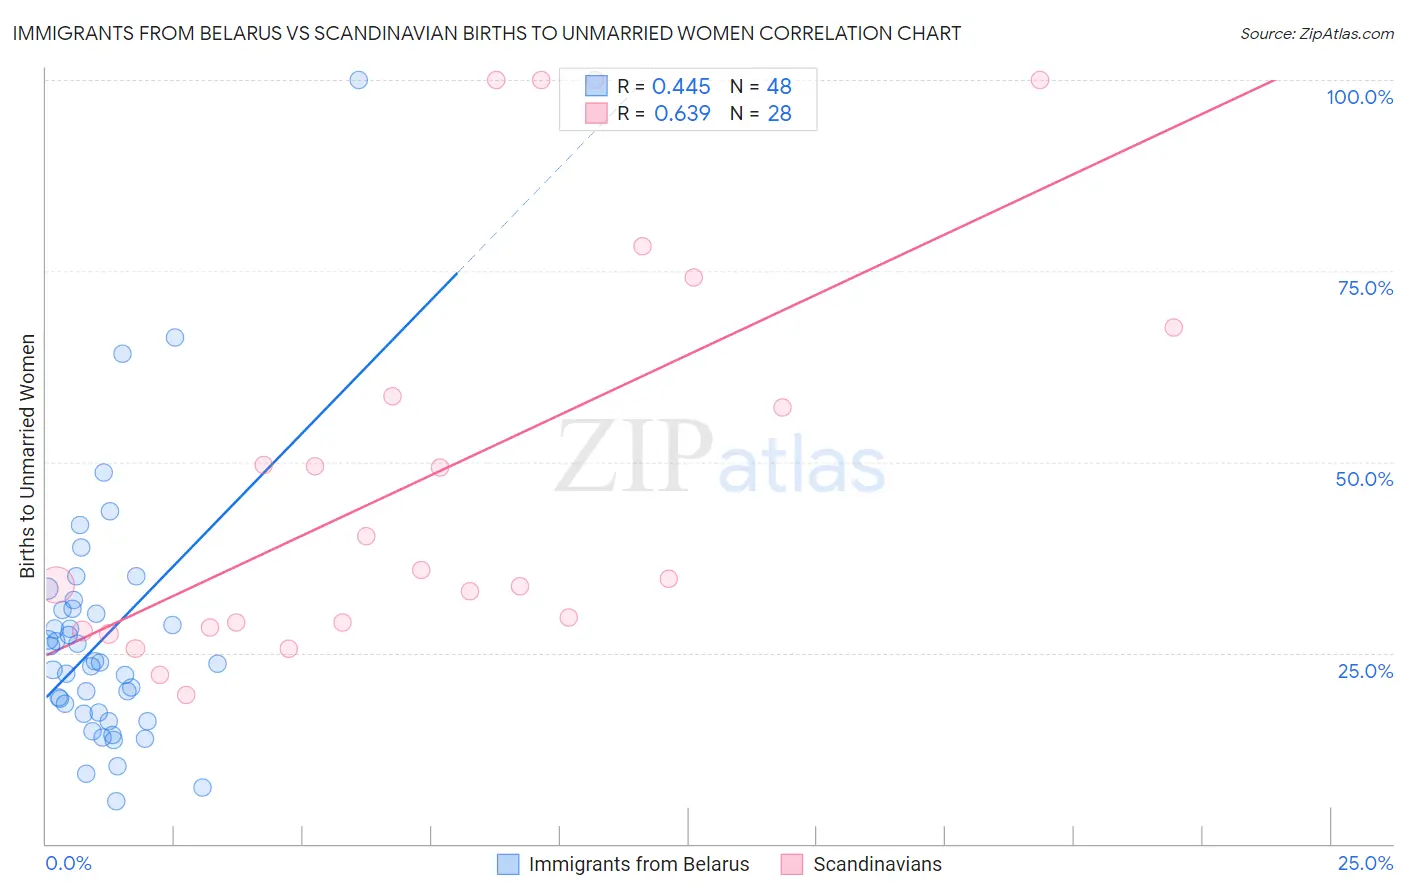
Immigrants from Belarus vs Scandinavian Births to Unmarried Women Correlation Chart
The statistical analysis conducted on geographies consisting of 142,991,373 people shows a moderate positive correlation between the proportion of Immigrants from Belarus and percentage of births to unmarried women in the United States with a correlation coefficient (R) of 0.445 and weighted average of 25.6%. Similarly, the statistical analysis conducted on geographies consisting of 430,139,153 people shows a significant positive correlation between the proportion of Scandinavians and percentage of births to unmarried women in the United States with a correlation coefficient (R) of 0.639 and weighted average of 29.8%, a difference of 16.1%.
Births to Unmarried Women Correlation Summary
| Measurement | Immigrants from Belarus | Scandinavian |
| Minimum | 5.6% | 19.6% |
| Maximum | 100.0% | 100.0% |
| Range | 94.4% | 80.4% |
| Mean | 27.0% | 48.5% |
| Median | 23.7% | 35.3% |
| Interquartile 25% (IQ1) | 17.1% | 28.6% |
| Interquartile 75% (IQ3) | 30.7% | 63.0% |
| Interquartile Range (IQR) | 13.5% | 34.4% |
| Standard Deviation (Sample) | 16.5% | 26.4% |
| Standard Deviation (Population) | 16.3% | 25.9% |
Similar Demographics by Births to Unmarried Women
Demographics Similar to Immigrants from Belarus by Births to Unmarried Women
In terms of births to unmarried women, the demographic groups most similar to Immigrants from Belarus are Immigrants from Singapore (25.6%, a difference of 0.050%), Immigrants from Uzbekistan (25.8%, a difference of 0.57%), Immigrants from Lebanon (25.3%, a difference of 1.2%), Iranian (25.3%, a difference of 1.3%), and Indian (Asian) (25.3%, a difference of 1.5%).
| Demographics | Rating | Rank | Births to Unmarried Women |
| Immigrants | South Central Asia | 100.0 /100 | #9 | Exceptional 24.7% |
| Immigrants | Eastern Asia | 100.0 /100 | #10 | Exceptional 25.0% |
| Immigrants | Israel | 100.0 /100 | #11 | Exceptional 25.1% |
| Indians (Asian) | 100.0 /100 | #12 | Exceptional 25.3% |
| Iranians | 100.0 /100 | #13 | Exceptional 25.3% |
| Immigrants | Lebanon | 100.0 /100 | #14 | Exceptional 25.3% |
| Immigrants | Singapore | 100.0 /100 | #15 | Exceptional 25.6% |
| Immigrants | Belarus | 100.0 /100 | #16 | Exceptional 25.6% |
| Immigrants | Uzbekistan | 100.0 /100 | #17 | Exceptional 25.8% |
| Immigrants | Armenia | 99.9 /100 | #18 | Exceptional 26.1% |
| Armenians | 99.9 /100 | #19 | Exceptional 26.2% |
| Immigrants | Korea | 99.9 /100 | #20 | Exceptional 26.3% |
| Soviet Union | 99.9 /100 | #21 | Exceptional 26.3% |
| Burmese | 99.9 /100 | #22 | Exceptional 26.4% |
| Immigrants | Japan | 99.9 /100 | #23 | Exceptional 26.4% |
Demographics Similar to Scandinavians by Births to Unmarried Women
In terms of births to unmarried women, the demographic groups most similar to Scandinavians are Immigrants from Croatia (29.8%, a difference of 0.060%), Basque (29.7%, a difference of 0.10%), Immigrants from Hungary (29.7%, a difference of 0.11%), Immigrants from Ethiopia (29.7%, a difference of 0.25%), and Greek (29.7%, a difference of 0.28%).
| Demographics | Rating | Rank | Births to Unmarried Women |
| Swedes | 93.8 /100 | #106 | Exceptional 29.6% |
| Immigrants | Brazil | 93.7 /100 | #107 | Exceptional 29.6% |
| Paraguayans | 93.5 /100 | #108 | Exceptional 29.7% |
| Greeks | 93.4 /100 | #109 | Exceptional 29.7% |
| Immigrants | Ethiopia | 93.4 /100 | #110 | Exceptional 29.7% |
| Immigrants | Hungary | 93.0 /100 | #111 | Exceptional 29.7% |
| Basques | 93.0 /100 | #112 | Exceptional 29.7% |
| Scandinavians | 92.7 /100 | #113 | Exceptional 29.8% |
| Immigrants | Croatia | 92.6 /100 | #114 | Exceptional 29.8% |
| Ethiopians | 91.9 /100 | #115 | Exceptional 29.8% |
| Immigrants | Italy | 91.7 /100 | #116 | Exceptional 29.9% |
| Immigrants | Netherlands | 91.1 /100 | #117 | Exceptional 29.9% |
| Immigrants | Norway | 91.0 /100 | #118 | Exceptional 29.9% |
| Argentineans | 90.5 /100 | #119 | Exceptional 30.0% |
| Ugandans | 89.2 /100 | #120 | Excellent 30.1% |