Nicaraguan vs Scandinavian Births to Unmarried Women
COMPARE
Nicaraguan
Scandinavian
Births to Unmarried Women
Births to Unmarried Women Comparison
Nicaraguans
Scandinavians
36.6%
BIRTHS TO UNMARRIED WOMEN
0.1/ 100
METRIC RATING
263rd/ 347
METRIC RANK
29.8%
BIRTHS TO UNMARRIED WOMEN
92.7/ 100
METRIC RATING
113th/ 347
METRIC RANK
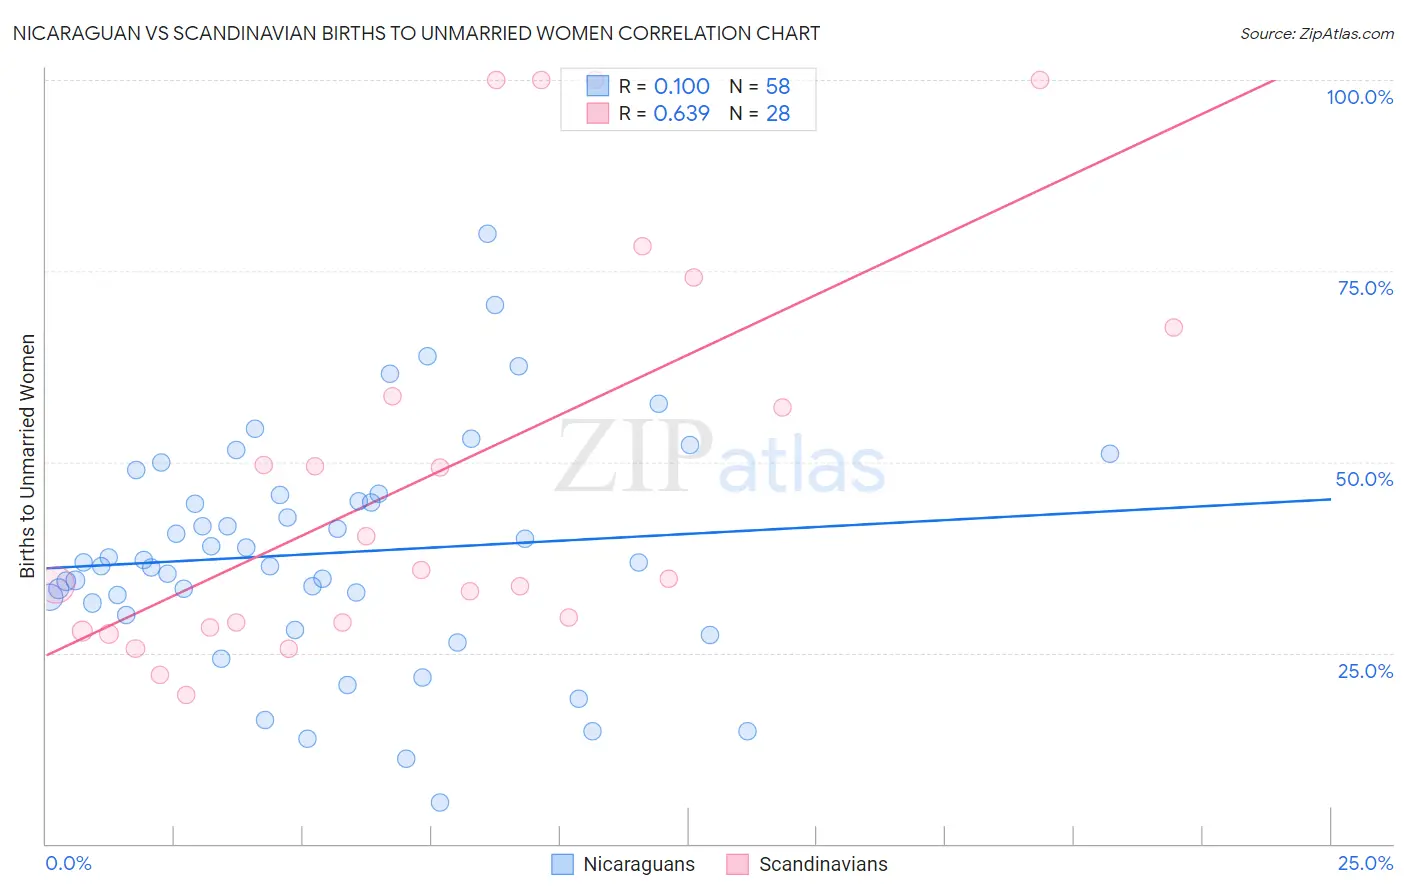
Nicaraguan vs Scandinavian Births to Unmarried Women Correlation Chart
The statistical analysis conducted on geographies consisting of 275,370,384 people shows a slight positive correlation between the proportion of Nicaraguans and percentage of births to unmarried women in the United States with a correlation coefficient (R) of 0.100 and weighted average of 36.6%. Similarly, the statistical analysis conducted on geographies consisting of 430,139,153 people shows a significant positive correlation between the proportion of Scandinavians and percentage of births to unmarried women in the United States with a correlation coefficient (R) of 0.639 and weighted average of 29.8%, a difference of 23.0%.
Births to Unmarried Women Correlation Summary
| Measurement | Nicaraguan | Scandinavian |
| Minimum | 5.4% | 19.6% |
| Maximum | 79.8% | 100.0% |
| Range | 74.4% | 80.4% |
| Mean | 38.1% | 48.5% |
| Median | 36.8% | 35.3% |
| Interquartile 25% (IQ1) | 31.5% | 28.6% |
| Interquartile 75% (IQ3) | 45.7% | 63.0% |
| Interquartile Range (IQR) | 14.2% | 34.4% |
| Standard Deviation (Sample) | 14.7% | 26.4% |
| Standard Deviation (Population) | 14.6% | 25.9% |
Similar Demographics by Births to Unmarried Women
Demographics Similar to Nicaraguans by Births to Unmarried Women
In terms of births to unmarried women, the demographic groups most similar to Nicaraguans are French American Indian (36.6%, a difference of 0.020%), Subsaharan African (36.7%, a difference of 0.12%), Cherokee (36.7%, a difference of 0.17%), Immigrants from Senegal (36.7%, a difference of 0.22%), and Central American (36.7%, a difference of 0.29%).
| Demographics | Rating | Rank | Births to Unmarried Women |
| Immigrants | Trinidad and Tobago | 0.2 /100 | #256 | Tragic 36.3% |
| Immigrants | Grenada | 0.2 /100 | #257 | Tragic 36.3% |
| Americans | 0.2 /100 | #258 | Tragic 36.4% |
| Immigrants | El Salvador | 0.2 /100 | #259 | Tragic 36.4% |
| Ottawa | 0.2 /100 | #260 | Tragic 36.5% |
| Trinidadians and Tobagonians | 0.2 /100 | #261 | Tragic 36.5% |
| French American Indians | 0.1 /100 | #262 | Tragic 36.6% |
| Nicaraguans | 0.1 /100 | #263 | Tragic 36.6% |
| Sub-Saharan Africans | 0.1 /100 | #264 | Tragic 36.7% |
| Cherokee | 0.1 /100 | #265 | Tragic 36.7% |
| Immigrants | Senegal | 0.1 /100 | #266 | Tragic 36.7% |
| Central Americans | 0.1 /100 | #267 | Tragic 36.7% |
| Comanche | 0.1 /100 | #268 | Tragic 36.7% |
| Senegalese | 0.1 /100 | #269 | Tragic 36.8% |
| Immigrants | Congo | 0.1 /100 | #270 | Tragic 36.8% |
Demographics Similar to Scandinavians by Births to Unmarried Women
In terms of births to unmarried women, the demographic groups most similar to Scandinavians are Immigrants from Croatia (29.8%, a difference of 0.060%), Basque (29.7%, a difference of 0.10%), Immigrants from Hungary (29.7%, a difference of 0.11%), Immigrants from Ethiopia (29.7%, a difference of 0.25%), and Greek (29.7%, a difference of 0.28%).
| Demographics | Rating | Rank | Births to Unmarried Women |
| Swedes | 93.8 /100 | #106 | Exceptional 29.6% |
| Immigrants | Brazil | 93.7 /100 | #107 | Exceptional 29.6% |
| Paraguayans | 93.5 /100 | #108 | Exceptional 29.7% |
| Greeks | 93.4 /100 | #109 | Exceptional 29.7% |
| Immigrants | Ethiopia | 93.4 /100 | #110 | Exceptional 29.7% |
| Immigrants | Hungary | 93.0 /100 | #111 | Exceptional 29.7% |
| Basques | 93.0 /100 | #112 | Exceptional 29.7% |
| Scandinavians | 92.7 /100 | #113 | Exceptional 29.8% |
| Immigrants | Croatia | 92.6 /100 | #114 | Exceptional 29.8% |
| Ethiopians | 91.9 /100 | #115 | Exceptional 29.8% |
| Immigrants | Italy | 91.7 /100 | #116 | Exceptional 29.9% |
| Immigrants | Netherlands | 91.1 /100 | #117 | Exceptional 29.9% |
| Immigrants | Norway | 91.0 /100 | #118 | Exceptional 29.9% |
| Argentineans | 90.5 /100 | #119 | Exceptional 30.0% |
| Ugandans | 89.2 /100 | #120 | Excellent 30.1% |