Slavic vs Immigrants from Uruguay Average Family Size
COMPARE
Slavic
Immigrants from Uruguay
Average Family Size
Average Family Size Comparison
Slavs
Immigrants from Uruguay
3.13
AVERAGE FAMILY SIZE
0.1/ 100
METRIC RATING
308th/ 347
METRIC RANK
3.23
AVERAGE FAMILY SIZE
52.0/ 100
METRIC RATING
173rd/ 347
METRIC RANK
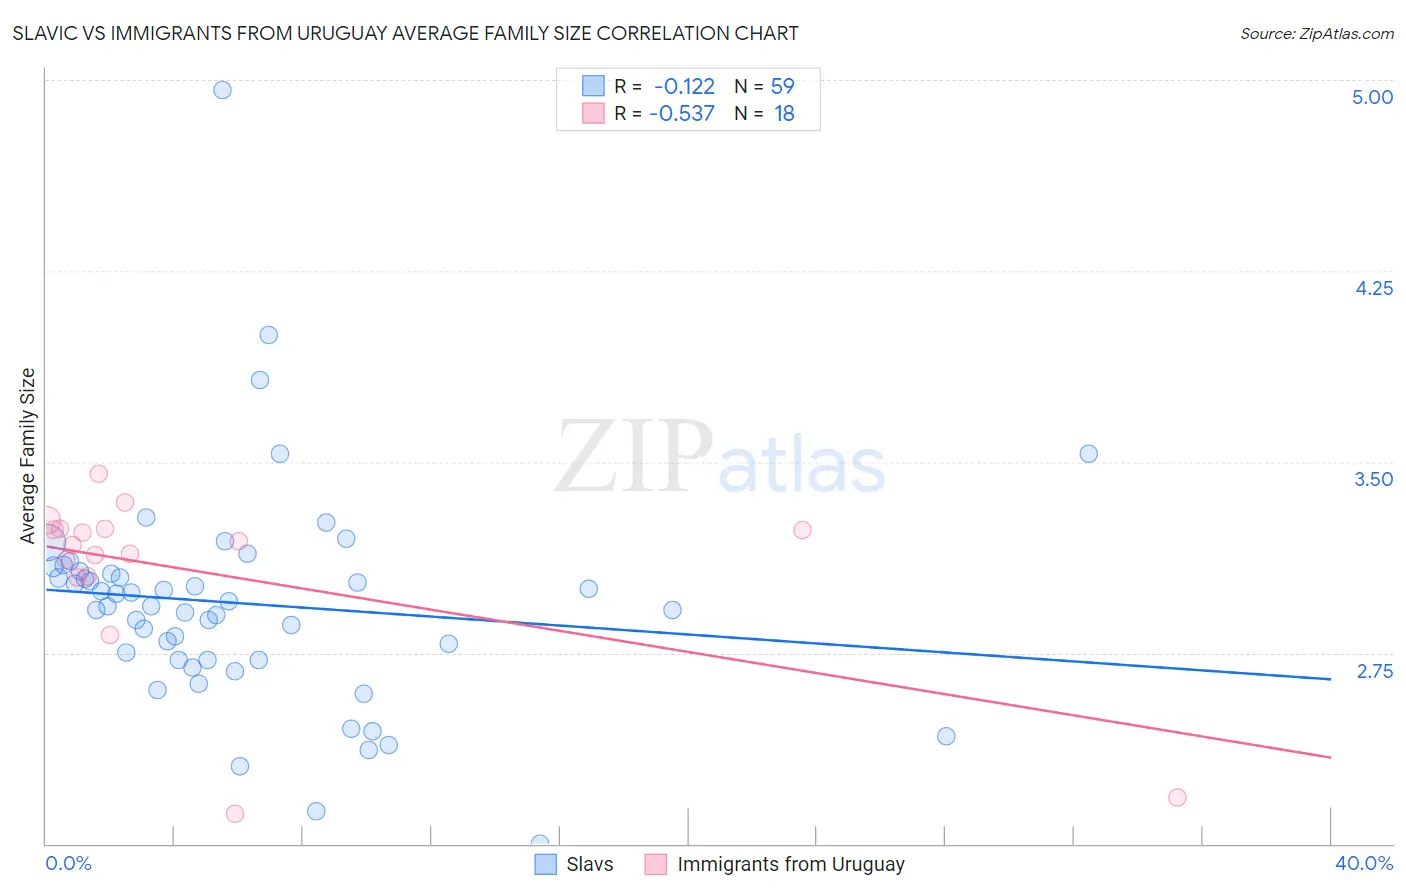
Slavic vs Immigrants from Uruguay Average Family Size Correlation Chart
The statistical analysis conducted on geographies consisting of 270,815,552 people shows a poor negative correlation between the proportion of Slavs and average family size in the United States with a correlation coefficient (R) of -0.122 and weighted average of 3.13. Similarly, the statistical analysis conducted on geographies consisting of 133,245,142 people shows a substantial negative correlation between the proportion of Immigrants from Uruguay and average family size in the United States with a correlation coefficient (R) of -0.537 and weighted average of 3.23, a difference of 3.2%.
Average Family Size Correlation Summary
| Measurement | Slavic | Immigrants from Uruguay |
| Minimum | 2.00 | 2.12 |
| Maximum | 4.96 | 3.46 |
| Range | 2.96 | 1.34 |
| Mean | 2.94 | 3.07 |
| Median | 2.93 | 3.18 |
| Interquartile 25% (IQ1) | 2.72 | 3.05 |
| Interquartile 75% (IQ3) | 3.07 | 3.24 |
| Interquartile Range (IQR) | 0.35 | 0.19 |
| Standard Deviation (Sample) | 0.44 | 0.36 |
| Standard Deviation (Population) | 0.44 | 0.35 |
Similar Demographics by Average Family Size
Demographics Similar to Slavs by Average Family Size
In terms of average family size, the demographic groups most similar to Slavs are Northern European (3.13, a difference of 0.010%), Czechoslovakian (3.13, a difference of 0.030%), Immigrants from Serbia (3.13, a difference of 0.050%), Immigrants from Ireland (3.13, a difference of 0.060%), and Immigrants from Northern Europe (3.13, a difference of 0.070%).
| Demographics | Rating | Rank | Average Family Size |
| Macedonians | 0.2 /100 | #301 | Tragic 3.13 |
| Immigrants | Latvia | 0.2 /100 | #302 | Tragic 3.13 |
| British | 0.2 /100 | #303 | Tragic 3.13 |
| Immigrants | Switzerland | 0.2 /100 | #304 | Tragic 3.13 |
| Australians | 0.1 /100 | #305 | Tragic 3.13 |
| Immigrants | Ireland | 0.1 /100 | #306 | Tragic 3.13 |
| Immigrants | Serbia | 0.1 /100 | #307 | Tragic 3.13 |
| Slavs | 0.1 /100 | #308 | Tragic 3.13 |
| Northern Europeans | 0.1 /100 | #309 | Tragic 3.13 |
| Czechoslovakians | 0.1 /100 | #310 | Tragic 3.13 |
| Immigrants | Northern Europe | 0.1 /100 | #311 | Tragic 3.13 |
| Immigrants | Australia | 0.1 /100 | #312 | Tragic 3.13 |
| Bulgarians | 0.1 /100 | #313 | Tragic 3.13 |
| Russians | 0.1 /100 | #314 | Tragic 3.12 |
| Immigrants | Scotland | 0.1 /100 | #315 | Tragic 3.12 |
Demographics Similar to Immigrants from Uruguay by Average Family Size
In terms of average family size, the demographic groups most similar to Immigrants from Uruguay are Immigrants from Congo (3.23, a difference of 0.010%), Chilean (3.23, a difference of 0.020%), Arab (3.23, a difference of 0.030%), Taiwanese (3.23, a difference of 0.040%), and Aleut (3.23, a difference of 0.040%).
| Demographics | Rating | Rank | Average Family Size |
| Immigrants | Senegal | 57.5 /100 | #166 | Average 3.23 |
| Dutch West Indians | 56.9 /100 | #167 | Average 3.23 |
| Taiwanese | 54.2 /100 | #168 | Average 3.23 |
| Aleuts | 54.1 /100 | #169 | Average 3.23 |
| Arabs | 53.8 /100 | #170 | Average 3.23 |
| Chileans | 53.2 /100 | #171 | Average 3.23 |
| Immigrants | Congo | 52.7 /100 | #172 | Average 3.23 |
| Immigrants | Uruguay | 52.0 /100 | #173 | Average 3.23 |
| Immigrants | South Central Asia | 50.0 /100 | #174 | Average 3.23 |
| Immigrants | China | 49.9 /100 | #175 | Average 3.23 |
| Israelis | 48.7 /100 | #176 | Average 3.23 |
| Argentineans | 47.4 /100 | #177 | Average 3.23 |
| Spaniards | 47.2 /100 | #178 | Average 3.23 |
| Immigrants | Korea | 46.9 /100 | #179 | Average 3.23 |
| Palestinians | 46.6 /100 | #180 | Average 3.23 |