Aleut vs Immigrants from Uruguay Average Family Size
COMPARE
Aleut
Immigrants from Uruguay
Average Family Size
Average Family Size Comparison
Aleuts
Immigrants from Uruguay
3.23
AVERAGE FAMILY SIZE
54.1/ 100
METRIC RATING
169th/ 347
METRIC RANK
3.23
AVERAGE FAMILY SIZE
52.0/ 100
METRIC RATING
173rd/ 347
METRIC RANK
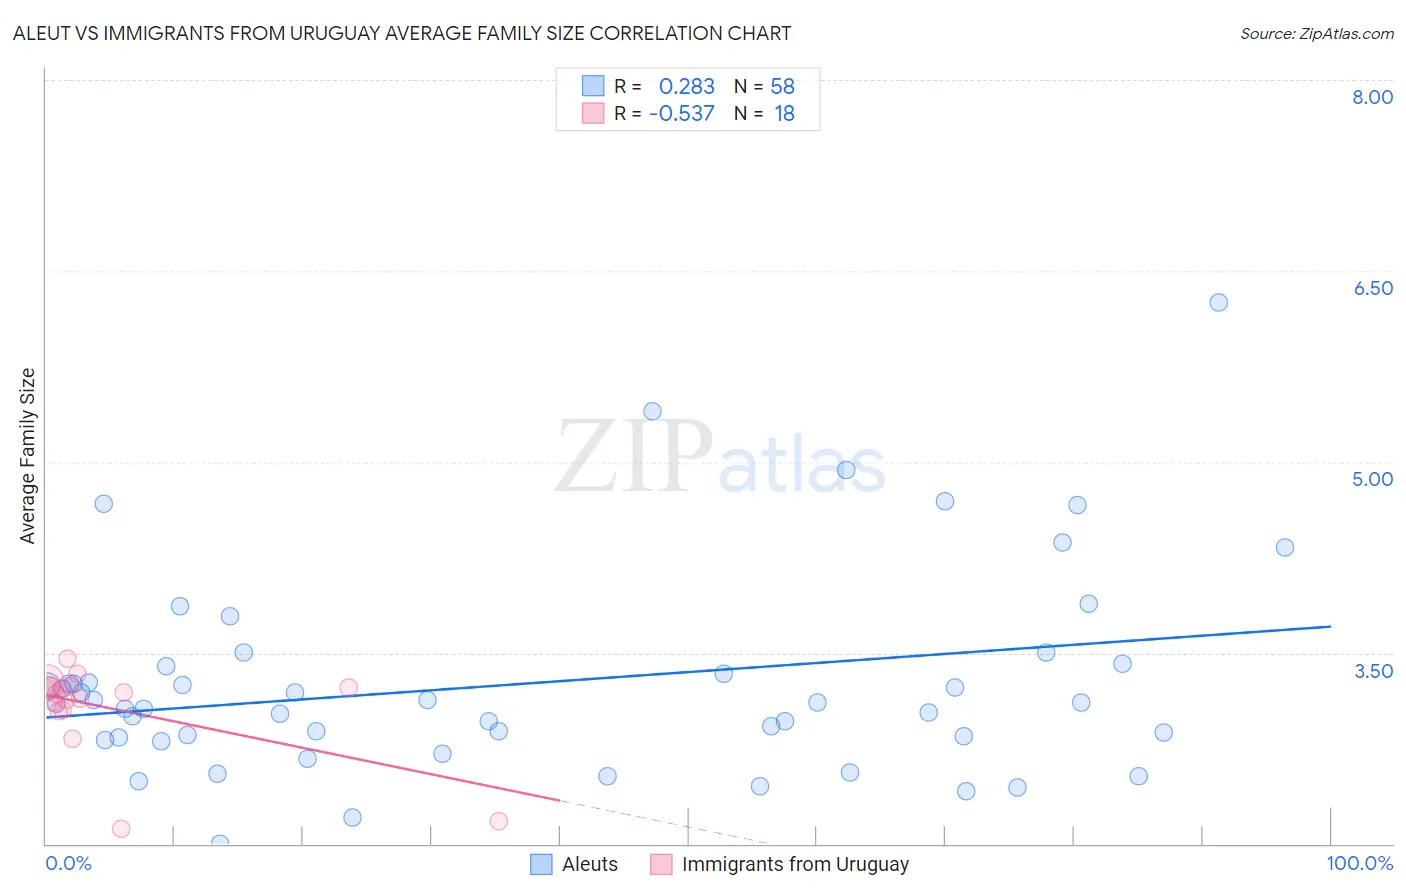
Aleut vs Immigrants from Uruguay Average Family Size Correlation Chart
The statistical analysis conducted on geographies consisting of 61,774,042 people shows a weak positive correlation between the proportion of Aleuts and average family size in the United States with a correlation coefficient (R) of 0.283 and weighted average of 3.23. Similarly, the statistical analysis conducted on geographies consisting of 133,245,142 people shows a substantial negative correlation between the proportion of Immigrants from Uruguay and average family size in the United States with a correlation coefficient (R) of -0.537 and weighted average of 3.23, a difference of 0.040%.
Average Family Size Correlation Summary
| Measurement | Aleut | Immigrants from Uruguay |
| Minimum | 2.00 | 2.12 |
| Maximum | 6.25 | 3.46 |
| Range | 4.25 | 1.34 |
| Mean | 3.26 | 3.07 |
| Median | 3.11 | 3.18 |
| Interquartile 25% (IQ1) | 2.84 | 3.05 |
| Interquartile 75% (IQ3) | 3.39 | 3.24 |
| Interquartile Range (IQR) | 0.55 | 0.19 |
| Standard Deviation (Sample) | 0.80 | 0.36 |
| Standard Deviation (Population) | 0.79 | 0.35 |
Demographics Similar to Aleuts and Immigrants from Uruguay by Average Family Size
In terms of average family size, the demographic groups most similar to Aleuts are Taiwanese (3.23, a difference of 0.0%), Arab (3.23, a difference of 0.010%), Chilean (3.23, a difference of 0.020%), Immigrants from Congo (3.23, a difference of 0.030%), and Dutch West Indian (3.23, a difference of 0.050%). Similarly, the demographic groups most similar to Immigrants from Uruguay are Immigrants from Congo (3.23, a difference of 0.010%), Chilean (3.23, a difference of 0.020%), Arab (3.23, a difference of 0.030%), Taiwanese (3.23, a difference of 0.040%), and Immigrants from South Central Asia (3.23, a difference of 0.040%).
| Demographics | Rating | Rank | Average Family Size |
| Immigrants | Chile | 63.2 /100 | #161 | Good 3.24 |
| Immigrants | Uganda | 60.1 /100 | #162 | Good 3.23 |
| Uruguayans | 58.8 /100 | #163 | Average 3.23 |
| Egyptians | 58.6 /100 | #164 | Average 3.23 |
| Ugandans | 58.4 /100 | #165 | Average 3.23 |
| Immigrants | Senegal | 57.5 /100 | #166 | Average 3.23 |
| Dutch West Indians | 56.9 /100 | #167 | Average 3.23 |
| Taiwanese | 54.2 /100 | #168 | Average 3.23 |
| Aleuts | 54.1 /100 | #169 | Average 3.23 |
| Arabs | 53.8 /100 | #170 | Average 3.23 |
| Chileans | 53.2 /100 | #171 | Average 3.23 |
| Immigrants | Congo | 52.7 /100 | #172 | Average 3.23 |
| Immigrants | Uruguay | 52.0 /100 | #173 | Average 3.23 |
| Immigrants | South Central Asia | 50.0 /100 | #174 | Average 3.23 |
| Immigrants | China | 49.9 /100 | #175 | Average 3.23 |
| Israelis | 48.7 /100 | #176 | Average 3.23 |
| Argentineans | 47.4 /100 | #177 | Average 3.23 |
| Spaniards | 47.2 /100 | #178 | Average 3.23 |
| Immigrants | Korea | 46.9 /100 | #179 | Average 3.23 |
| Palestinians | 46.6 /100 | #180 | Average 3.23 |
| Spanish | 44.8 /100 | #181 | Average 3.23 |