Chickasaw vs Immigrants from Uruguay Median Earnings
COMPARE
Chickasaw
Immigrants from Uruguay
Median Earnings
Median Earnings Comparison
Chickasaw
Immigrants from Uruguay
$40,672
MEDIAN EARNINGS
0.0/ 100
METRIC RATING
305th/ 347
METRIC RANK
$45,682
MEDIAN EARNINGS
25.9/ 100
METRIC RATING
204th/ 347
METRIC RANK
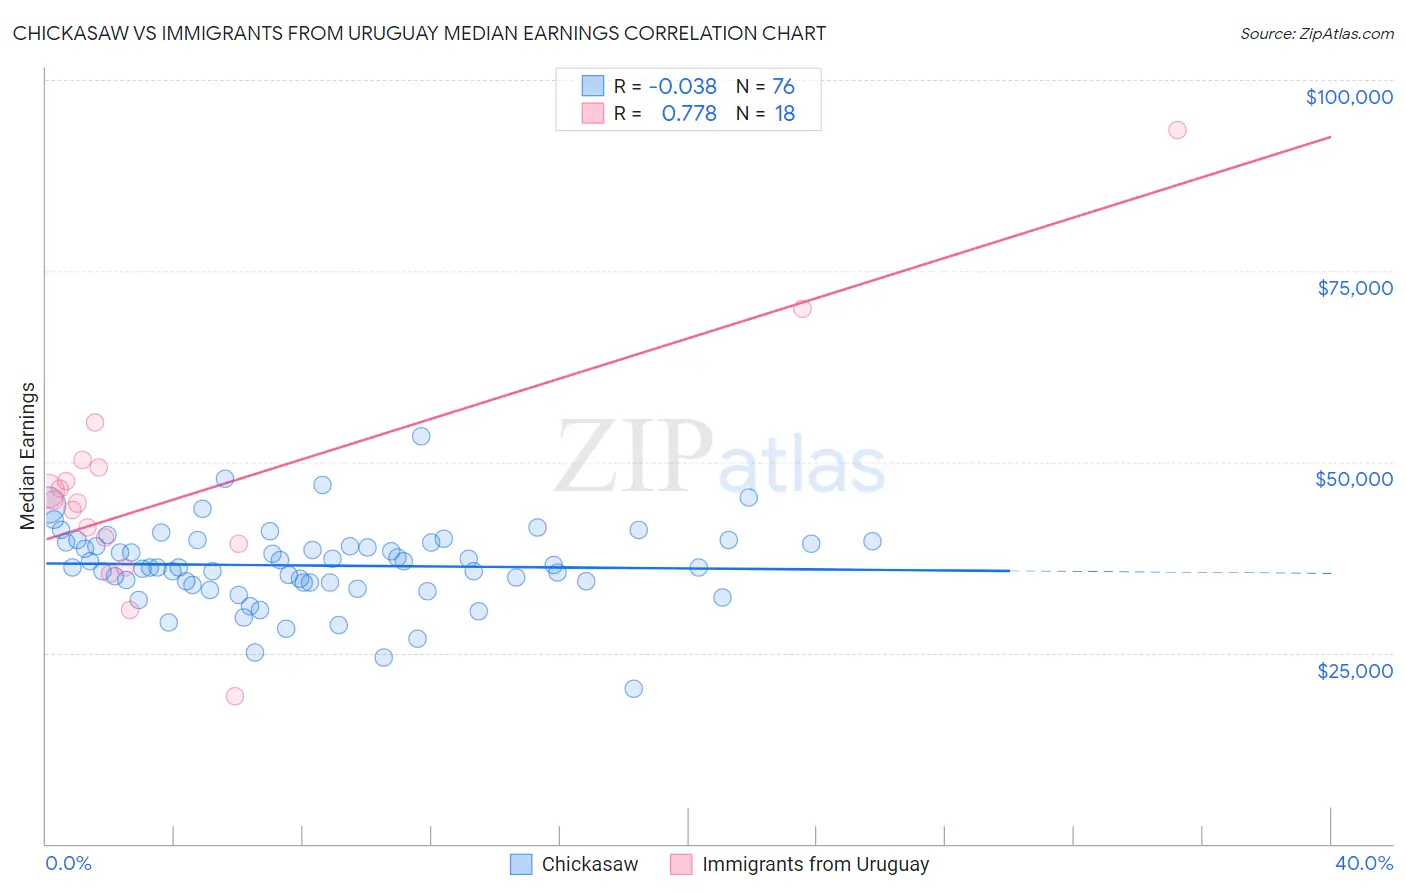
Chickasaw vs Immigrants from Uruguay Median Earnings Correlation Chart
The statistical analysis conducted on geographies consisting of 147,718,191 people shows no correlation between the proportion of Chickasaw and median earnings in the United States with a correlation coefficient (R) of -0.038 and weighted average of $40,672. Similarly, the statistical analysis conducted on geographies consisting of 133,259,667 people shows a strong positive correlation between the proportion of Immigrants from Uruguay and median earnings in the United States with a correlation coefficient (R) of 0.778 and weighted average of $45,682, a difference of 12.3%.
Median Earnings Correlation Summary
| Measurement | Chickasaw | Immigrants from Uruguay |
| Minimum | $20,250 | $19,375 |
| Maximum | $53,432 | $93,387 |
| Range | $33,182 | $74,012 |
| Mean | $36,428 | $46,310 |
| Median | $36,238 | $44,791 |
| Interquartile 25% (IQ1) | $34,220 | $39,250 |
| Interquartile 75% (IQ3) | $39,491 | $49,312 |
| Interquartile Range (IQR) | $5,270 | $10,062 |
| Standard Deviation (Sample) | $5,289 | $15,725 |
| Standard Deviation (Population) | $5,254 | $15,282 |
Similar Demographics by Median Earnings
Demographics Similar to Chickasaw by Median Earnings
In terms of median earnings, the demographic groups most similar to Chickasaw are Yaqui ($40,647, a difference of 0.060%), Honduran ($40,638, a difference of 0.080%), Cuban ($40,619, a difference of 0.13%), Immigrants from Haiti ($40,550, a difference of 0.30%), and Immigrants from Guatemala ($40,851, a difference of 0.44%).
| Demographics | Rating | Rank | Median Earnings |
| Immigrants | Micronesia | 0.1 /100 | #298 | Tragic $41,133 |
| Immigrants | Caribbean | 0.1 /100 | #299 | Tragic $41,119 |
| Ute | 0.1 /100 | #300 | Tragic $41,051 |
| Immigrants | Latin America | 0.1 /100 | #301 | Tragic $41,049 |
| Shoshone | 0.0 /100 | #302 | Tragic $40,932 |
| Haitians | 0.0 /100 | #303 | Tragic $40,918 |
| Immigrants | Guatemala | 0.0 /100 | #304 | Tragic $40,851 |
| Chickasaw | 0.0 /100 | #305 | Tragic $40,672 |
| Yaqui | 0.0 /100 | #306 | Tragic $40,647 |
| Hondurans | 0.0 /100 | #307 | Tragic $40,638 |
| Cubans | 0.0 /100 | #308 | Tragic $40,619 |
| Immigrants | Haiti | 0.0 /100 | #309 | Tragic $40,550 |
| Apache | 0.0 /100 | #310 | Tragic $40,388 |
| Hispanics or Latinos | 0.0 /100 | #311 | Tragic $40,288 |
| Chippewa | 0.0 /100 | #312 | Tragic $40,287 |
Demographics Similar to Immigrants from Uruguay by Median Earnings
In terms of median earnings, the demographic groups most similar to Immigrants from Uruguay are Tongan ($45,665, a difference of 0.040%), Welsh ($45,710, a difference of 0.060%), Immigrants from Ghana ($45,641, a difference of 0.090%), Immigrants from Trinidad and Tobago ($45,729, a difference of 0.10%), and Celtic ($45,732, a difference of 0.11%).
| Demographics | Rating | Rank | Median Earnings |
| Barbadians | 30.5 /100 | #197 | Fair $45,846 |
| Trinidadians and Tobagonians | 29.7 /100 | #198 | Fair $45,820 |
| Immigrants | Barbados | 29.6 /100 | #199 | Fair $45,816 |
| Immigrants | Azores | 29.5 /100 | #200 | Fair $45,812 |
| Celtics | 27.2 /100 | #201 | Fair $45,732 |
| Immigrants | Trinidad and Tobago | 27.1 /100 | #202 | Fair $45,729 |
| Welsh | 26.6 /100 | #203 | Fair $45,710 |
| Immigrants | Uruguay | 25.9 /100 | #204 | Fair $45,682 |
| Tongans | 25.4 /100 | #205 | Fair $45,665 |
| Immigrants | Ghana | 24.8 /100 | #206 | Fair $45,641 |
| Immigrants | Senegal | 24.0 /100 | #207 | Fair $45,611 |
| Immigrants | Bosnia and Herzegovina | 23.7 /100 | #208 | Fair $45,600 |
| Immigrants | Thailand | 23.7 /100 | #209 | Fair $45,598 |
| Immigrants | Grenada | 23.6 /100 | #210 | Fair $45,596 |
| Panamanians | 23.5 /100 | #211 | Fair $45,593 |