Chickasaw vs Central American Indian Currently Married
COMPARE
Chickasaw
Central American Indian
Currently Married
Currently Married Comparison
Chickasaw
Central American Indians
46.6%
CURRENTLY MARRIED
47.8/ 100
METRIC RATING
178th/ 347
METRIC RANK
43.3%
CURRENTLY MARRIED
0.0/ 100
METRIC RATING
279th/ 347
METRIC RANK
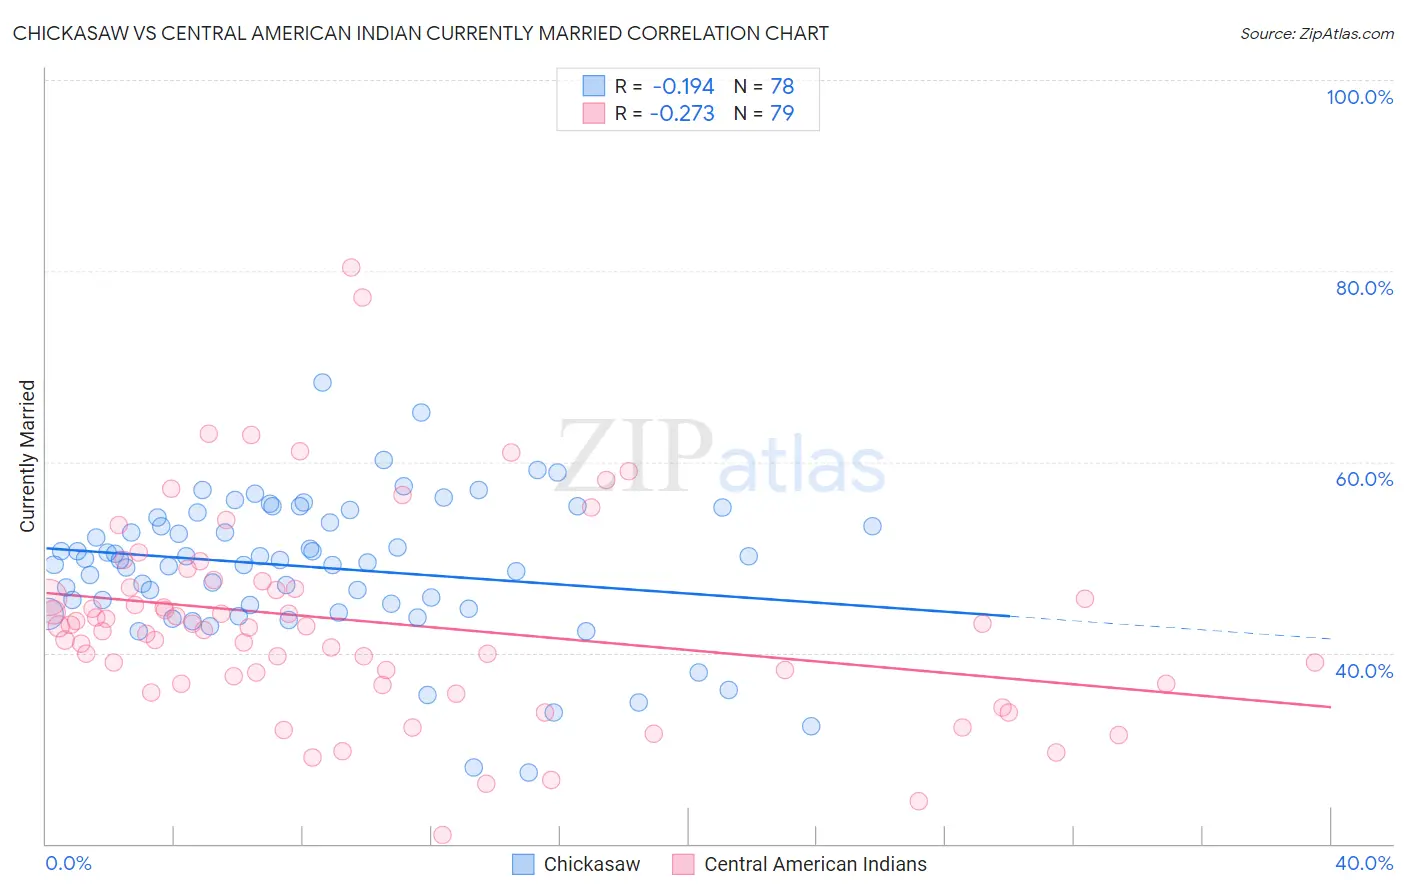
Chickasaw vs Central American Indian Currently Married Correlation Chart
The statistical analysis conducted on geographies consisting of 147,723,431 people shows a poor negative correlation between the proportion of Chickasaw and percentage of population currently married in the United States with a correlation coefficient (R) of -0.194 and weighted average of 46.6%. Similarly, the statistical analysis conducted on geographies consisting of 326,134,160 people shows a weak negative correlation between the proportion of Central American Indians and percentage of population currently married in the United States with a correlation coefficient (R) of -0.273 and weighted average of 43.3%, a difference of 7.7%.
Currently Married Correlation Summary
| Measurement | Chickasaw | Central American Indian |
| Minimum | 27.5% | 20.9% |
| Maximum | 68.4% | 80.4% |
| Range | 40.9% | 59.5% |
| Mean | 48.9% | 43.3% |
| Median | 49.7% | 42.8% |
| Interquartile 25% (IQ1) | 45.0% | 36.8% |
| Interquartile 75% (IQ3) | 54.2% | 46.8% |
| Interquartile Range (IQR) | 9.2% | 10.0% |
| Standard Deviation (Sample) | 7.5% | 10.6% |
| Standard Deviation (Population) | 7.4% | 10.5% |
Similar Demographics by Currently Married
Demographics Similar to Chickasaw by Currently Married
In terms of currently married, the demographic groups most similar to Chickasaw are Hawaiian (46.6%, a difference of 0.030%), Israeli (46.6%, a difference of 0.030%), Immigrants from Brazil (46.6%, a difference of 0.070%), Peruvian (46.6%, a difference of 0.080%), and Tlingit-Haida (46.7%, a difference of 0.12%).
| Demographics | Rating | Rank | Currently Married |
| Immigrants | Zimbabwe | 52.4 /100 | #171 | Average 46.7% |
| Aleuts | 52.0 /100 | #172 | Average 46.7% |
| Tlingit-Haida | 51.2 /100 | #173 | Average 46.7% |
| Peruvians | 50.0 /100 | #174 | Average 46.6% |
| Immigrants | Brazil | 49.9 /100 | #175 | Average 46.6% |
| Hawaiians | 48.6 /100 | #176 | Average 46.6% |
| Israelis | 48.6 /100 | #177 | Average 46.6% |
| Chickasaw | 47.8 /100 | #178 | Average 46.6% |
| Immigrants | Oceania | 44.6 /100 | #179 | Average 46.5% |
| Costa Ricans | 43.7 /100 | #180 | Average 46.5% |
| Ottawa | 43.0 /100 | #181 | Average 46.5% |
| Potawatomi | 41.9 /100 | #182 | Average 46.5% |
| Immigrants | Northern Africa | 39.7 /100 | #183 | Fair 46.5% |
| Brazilians | 39.3 /100 | #184 | Fair 46.4% |
| Mongolians | 37.6 /100 | #185 | Fair 46.4% |
Demographics Similar to Central American Indians by Currently Married
In terms of currently married, the demographic groups most similar to Central American Indians are Apache (43.2%, a difference of 0.080%), Chippewa (43.2%, a difference of 0.080%), Central American (43.3%, a difference of 0.15%), Immigrants from Ecuador (43.2%, a difference of 0.16%), and Kiowa (43.2%, a difference of 0.27%).
| Demographics | Rating | Rank | Currently Married |
| Indonesians | 0.1 /100 | #272 | Tragic 43.5% |
| Yaqui | 0.1 /100 | #273 | Tragic 43.4% |
| Nigerians | 0.1 /100 | #274 | Tragic 43.4% |
| Colville | 0.1 /100 | #275 | Tragic 43.4% |
| Sierra Leoneans | 0.1 /100 | #276 | Tragic 43.4% |
| Immigrants | Nigeria | 0.1 /100 | #277 | Tragic 43.4% |
| Central Americans | 0.0 /100 | #278 | Tragic 43.3% |
| Central American Indians | 0.0 /100 | #279 | Tragic 43.3% |
| Apache | 0.0 /100 | #280 | Tragic 43.2% |
| Chippewa | 0.0 /100 | #281 | Tragic 43.2% |
| Immigrants | Ecuador | 0.0 /100 | #282 | Tragic 43.2% |
| Kiowa | 0.0 /100 | #283 | Tragic 43.2% |
| Immigrants | El Salvador | 0.0 /100 | #284 | Tragic 43.1% |
| Immigrants | Middle Africa | 0.0 /100 | #285 | Tragic 43.0% |
| Ghanaians | 0.0 /100 | #286 | Tragic 42.9% |