Immigrants from Germany vs Central American Indian Currently Married
COMPARE
Immigrants from Germany
Central American Indian
Currently Married
Currently Married Comparison
Immigrants from Germany
Central American Indians
47.8%
CURRENTLY MARRIED
94.1/ 100
METRIC RATING
101st/ 347
METRIC RANK
43.3%
CURRENTLY MARRIED
0.0/ 100
METRIC RATING
279th/ 347
METRIC RANK
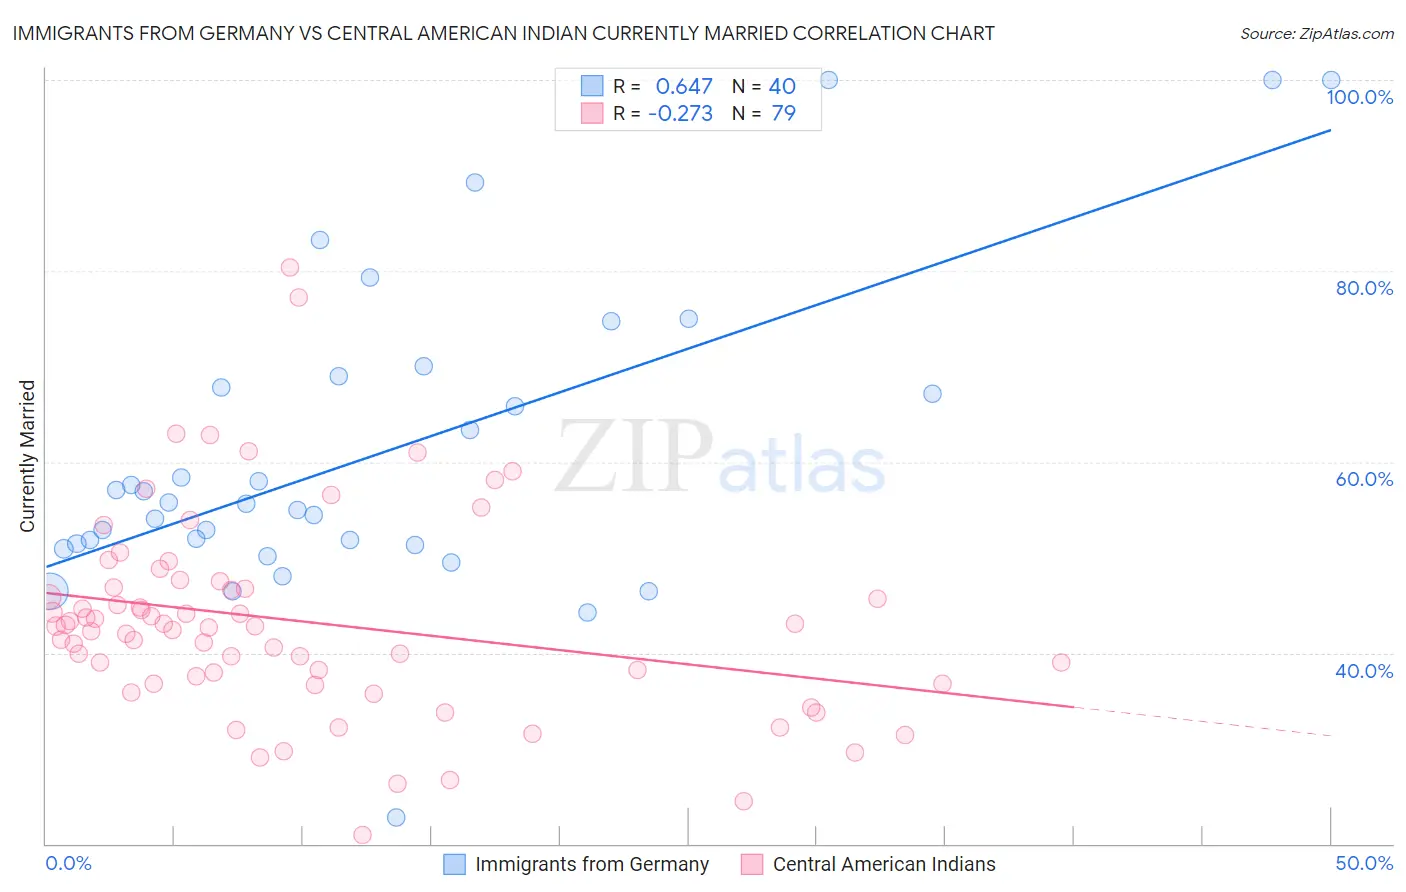
Immigrants from Germany vs Central American Indian Currently Married Correlation Chart
The statistical analysis conducted on geographies consisting of 463,859,108 people shows a significant positive correlation between the proportion of Immigrants from Germany and percentage of population currently married in the United States with a correlation coefficient (R) of 0.647 and weighted average of 47.8%. Similarly, the statistical analysis conducted on geographies consisting of 326,134,160 people shows a weak negative correlation between the proportion of Central American Indians and percentage of population currently married in the United States with a correlation coefficient (R) of -0.273 and weighted average of 43.3%, a difference of 10.5%.
Currently Married Correlation Summary
| Measurement | Immigrants from Germany | Central American Indian |
| Minimum | 22.7% | 20.9% |
| Maximum | 100.0% | 80.4% |
| Range | 77.3% | 59.5% |
| Mean | 60.9% | 43.3% |
| Median | 55.7% | 42.8% |
| Interquartile 25% (IQ1) | 51.4% | 36.8% |
| Interquartile 75% (IQ3) | 68.4% | 46.8% |
| Interquartile Range (IQR) | 17.0% | 10.0% |
| Standard Deviation (Sample) | 16.5% | 10.6% |
| Standard Deviation (Population) | 16.3% | 10.5% |
Similar Demographics by Currently Married
Demographics Similar to Immigrants from Germany by Currently Married
In terms of currently married, the demographic groups most similar to Immigrants from Germany are Celtic (47.8%, a difference of 0.020%), Turkish (47.8%, a difference of 0.020%), Immigrants from Sweden (47.8%, a difference of 0.040%), Cypriot (47.8%, a difference of 0.050%), and Serbian (47.8%, a difference of 0.070%).
| Demographics | Rating | Rank | Currently Married |
| Native Hawaiians | 95.0 /100 | #94 | Exceptional 47.9% |
| Immigrants | Bulgaria | 94.8 /100 | #95 | Exceptional 47.9% |
| Egyptians | 94.8 /100 | #96 | Exceptional 47.9% |
| Immigrants | Ukraine | 94.8 /100 | #97 | Exceptional 47.9% |
| Immigrants | China | 94.7 /100 | #98 | Exceptional 47.9% |
| Immigrants | Sweden | 94.3 /100 | #99 | Exceptional 47.8% |
| Celtics | 94.2 /100 | #100 | Exceptional 47.8% |
| Immigrants | Germany | 94.1 /100 | #101 | Exceptional 47.8% |
| Turks | 93.9 /100 | #102 | Exceptional 47.8% |
| Cypriots | 93.7 /100 | #103 | Exceptional 47.8% |
| Serbians | 93.6 /100 | #104 | Exceptional 47.8% |
| Immigrants | Singapore | 93.3 /100 | #105 | Exceptional 47.8% |
| Immigrants | Greece | 93.1 /100 | #106 | Exceptional 47.7% |
| Immigrants | Italy | 92.9 /100 | #107 | Exceptional 47.7% |
| Tsimshian | 92.4 /100 | #108 | Exceptional 47.7% |
Demographics Similar to Central American Indians by Currently Married
In terms of currently married, the demographic groups most similar to Central American Indians are Apache (43.2%, a difference of 0.080%), Chippewa (43.2%, a difference of 0.080%), Central American (43.3%, a difference of 0.15%), Immigrants from Ecuador (43.2%, a difference of 0.16%), and Kiowa (43.2%, a difference of 0.27%).
| Demographics | Rating | Rank | Currently Married |
| Indonesians | 0.1 /100 | #272 | Tragic 43.5% |
| Yaqui | 0.1 /100 | #273 | Tragic 43.4% |
| Nigerians | 0.1 /100 | #274 | Tragic 43.4% |
| Colville | 0.1 /100 | #275 | Tragic 43.4% |
| Sierra Leoneans | 0.1 /100 | #276 | Tragic 43.4% |
| Immigrants | Nigeria | 0.1 /100 | #277 | Tragic 43.4% |
| Central Americans | 0.0 /100 | #278 | Tragic 43.3% |
| Central American Indians | 0.0 /100 | #279 | Tragic 43.3% |
| Apache | 0.0 /100 | #280 | Tragic 43.2% |
| Chippewa | 0.0 /100 | #281 | Tragic 43.2% |
| Immigrants | Ecuador | 0.0 /100 | #282 | Tragic 43.2% |
| Kiowa | 0.0 /100 | #283 | Tragic 43.2% |
| Immigrants | El Salvador | 0.0 /100 | #284 | Tragic 43.1% |
| Immigrants | Middle Africa | 0.0 /100 | #285 | Tragic 43.0% |
| Ghanaians | 0.0 /100 | #286 | Tragic 42.9% |