Chickasaw vs Immigrants from Hungary Currently Married
COMPARE
Chickasaw
Immigrants from Hungary
Currently Married
Currently Married Comparison
Chickasaw
Immigrants from Hungary
46.6%
CURRENTLY MARRIED
47.8/ 100
METRIC RATING
178th/ 347
METRIC RANK
47.6%
CURRENTLY MARRIED
91.2/ 100
METRIC RATING
111th/ 347
METRIC RANK
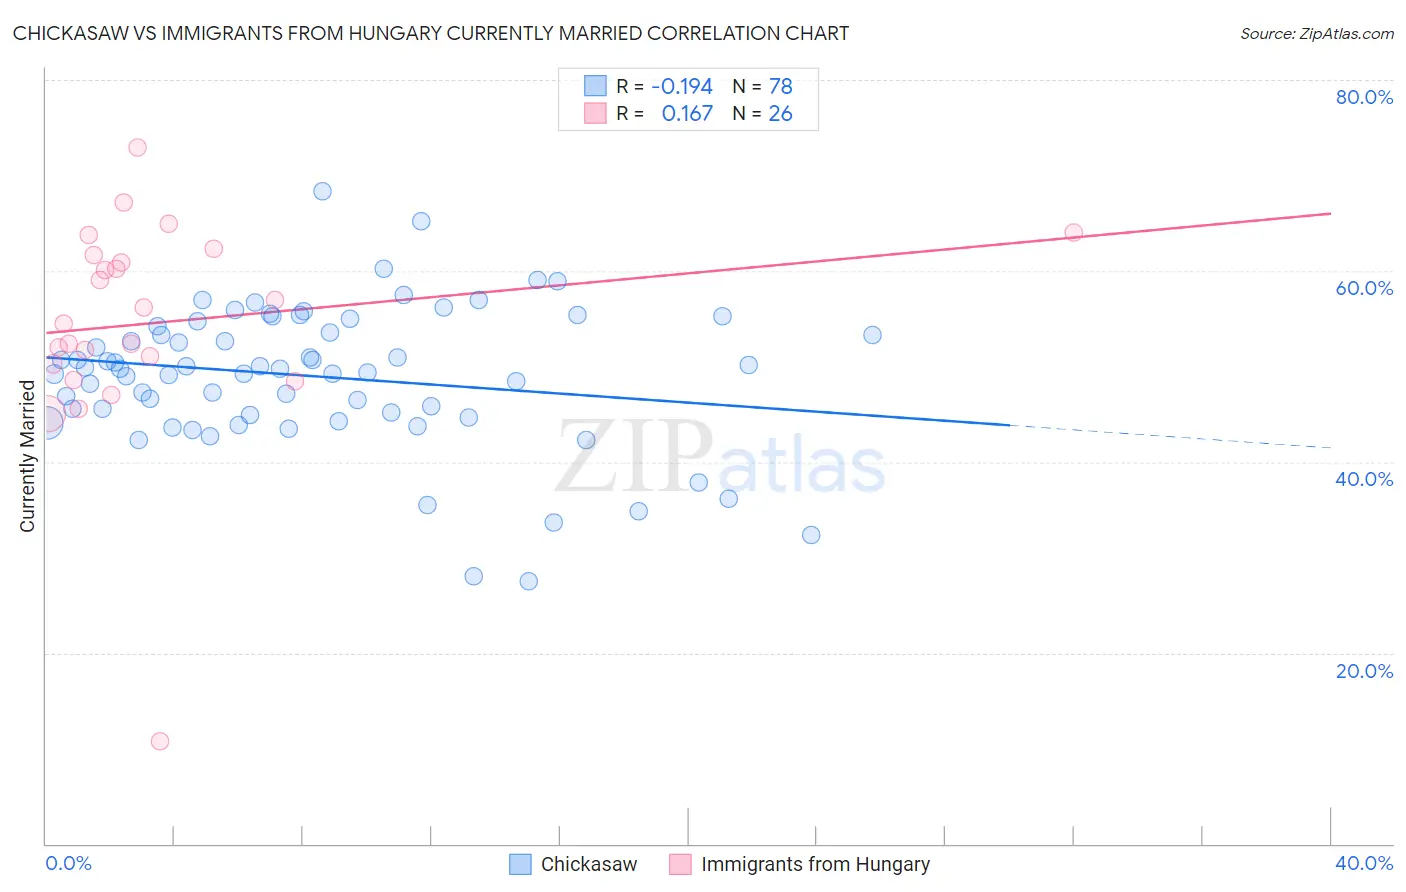
Chickasaw vs Immigrants from Hungary Currently Married Correlation Chart
The statistical analysis conducted on geographies consisting of 147,723,431 people shows a poor negative correlation between the proportion of Chickasaw and percentage of population currently married in the United States with a correlation coefficient (R) of -0.194 and weighted average of 46.6%. Similarly, the statistical analysis conducted on geographies consisting of 195,704,410 people shows a poor positive correlation between the proportion of Immigrants from Hungary and percentage of population currently married in the United States with a correlation coefficient (R) of 0.167 and weighted average of 47.6%, a difference of 2.2%.
Currently Married Correlation Summary
| Measurement | Chickasaw | Immigrants from Hungary |
| Minimum | 27.5% | 10.7% |
| Maximum | 68.4% | 72.9% |
| Range | 40.9% | 62.2% |
| Mean | 48.9% | 54.6% |
| Median | 49.7% | 55.3% |
| Interquartile 25% (IQ1) | 45.0% | 50.3% |
| Interquartile 75% (IQ3) | 54.2% | 61.7% |
| Interquartile Range (IQR) | 9.2% | 11.4% |
| Standard Deviation (Sample) | 7.5% | 11.5% |
| Standard Deviation (Population) | 7.4% | 11.3% |
Similar Demographics by Currently Married
Demographics Similar to Chickasaw by Currently Married
In terms of currently married, the demographic groups most similar to Chickasaw are Hawaiian (46.6%, a difference of 0.030%), Israeli (46.6%, a difference of 0.030%), Immigrants from Brazil (46.6%, a difference of 0.070%), Peruvian (46.6%, a difference of 0.080%), and Tlingit-Haida (46.7%, a difference of 0.12%).
| Demographics | Rating | Rank | Currently Married |
| Immigrants | Zimbabwe | 52.4 /100 | #171 | Average 46.7% |
| Aleuts | 52.0 /100 | #172 | Average 46.7% |
| Tlingit-Haida | 51.2 /100 | #173 | Average 46.7% |
| Peruvians | 50.0 /100 | #174 | Average 46.6% |
| Immigrants | Brazil | 49.9 /100 | #175 | Average 46.6% |
| Hawaiians | 48.6 /100 | #176 | Average 46.6% |
| Israelis | 48.6 /100 | #177 | Average 46.6% |
| Chickasaw | 47.8 /100 | #178 | Average 46.6% |
| Immigrants | Oceania | 44.6 /100 | #179 | Average 46.5% |
| Costa Ricans | 43.7 /100 | #180 | Average 46.5% |
| Ottawa | 43.0 /100 | #181 | Average 46.5% |
| Potawatomi | 41.9 /100 | #182 | Average 46.5% |
| Immigrants | Northern Africa | 39.7 /100 | #183 | Fair 46.5% |
| Brazilians | 39.3 /100 | #184 | Fair 46.4% |
| Mongolians | 37.6 /100 | #185 | Fair 46.4% |
Demographics Similar to Immigrants from Hungary by Currently Married
In terms of currently married, the demographic groups most similar to Immigrants from Hungary are Immigrants from Western Europe (47.6%, a difference of 0.010%), Immigrants from Denmark (47.6%, a difference of 0.040%), South African (47.6%, a difference of 0.070%), Immigrants from Indonesia (47.6%, a difference of 0.070%), and Palestinian (47.6%, a difference of 0.080%).
| Demographics | Rating | Rank | Currently Married |
| Serbians | 93.6 /100 | #104 | Exceptional 47.8% |
| Immigrants | Singapore | 93.3 /100 | #105 | Exceptional 47.8% |
| Immigrants | Greece | 93.1 /100 | #106 | Exceptional 47.7% |
| Immigrants | Italy | 92.9 /100 | #107 | Exceptional 47.7% |
| Tsimshian | 92.4 /100 | #108 | Exceptional 47.7% |
| Immigrants | Egypt | 92.3 /100 | #109 | Exceptional 47.7% |
| Immigrants | Russia | 92.0 /100 | #110 | Exceptional 47.7% |
| Immigrants | Hungary | 91.2 /100 | #111 | Exceptional 47.6% |
| Immigrants | Western Europe | 91.1 /100 | #112 | Exceptional 47.6% |
| Immigrants | Denmark | 90.9 /100 | #113 | Exceptional 47.6% |
| South Africans | 90.5 /100 | #114 | Exceptional 47.6% |
| Immigrants | Indonesia | 90.5 /100 | #115 | Exceptional 47.6% |
| Palestinians | 90.4 /100 | #116 | Exceptional 47.6% |
| Puget Sound Salish | 90.3 /100 | #117 | Exceptional 47.6% |
| Immigrants | Philippines | 90.2 /100 | #118 | Exceptional 47.6% |