Chickasaw vs Immigrants from Mexico Currently Married
COMPARE
Chickasaw
Immigrants from Mexico
Currently Married
Currently Married Comparison
Chickasaw
Immigrants from Mexico
46.6%
CURRENTLY MARRIED
47.8/ 100
METRIC RATING
178th/ 347
METRIC RANK
44.5%
CURRENTLY MARRIED
0.7/ 100
METRIC RATING
239th/ 347
METRIC RANK
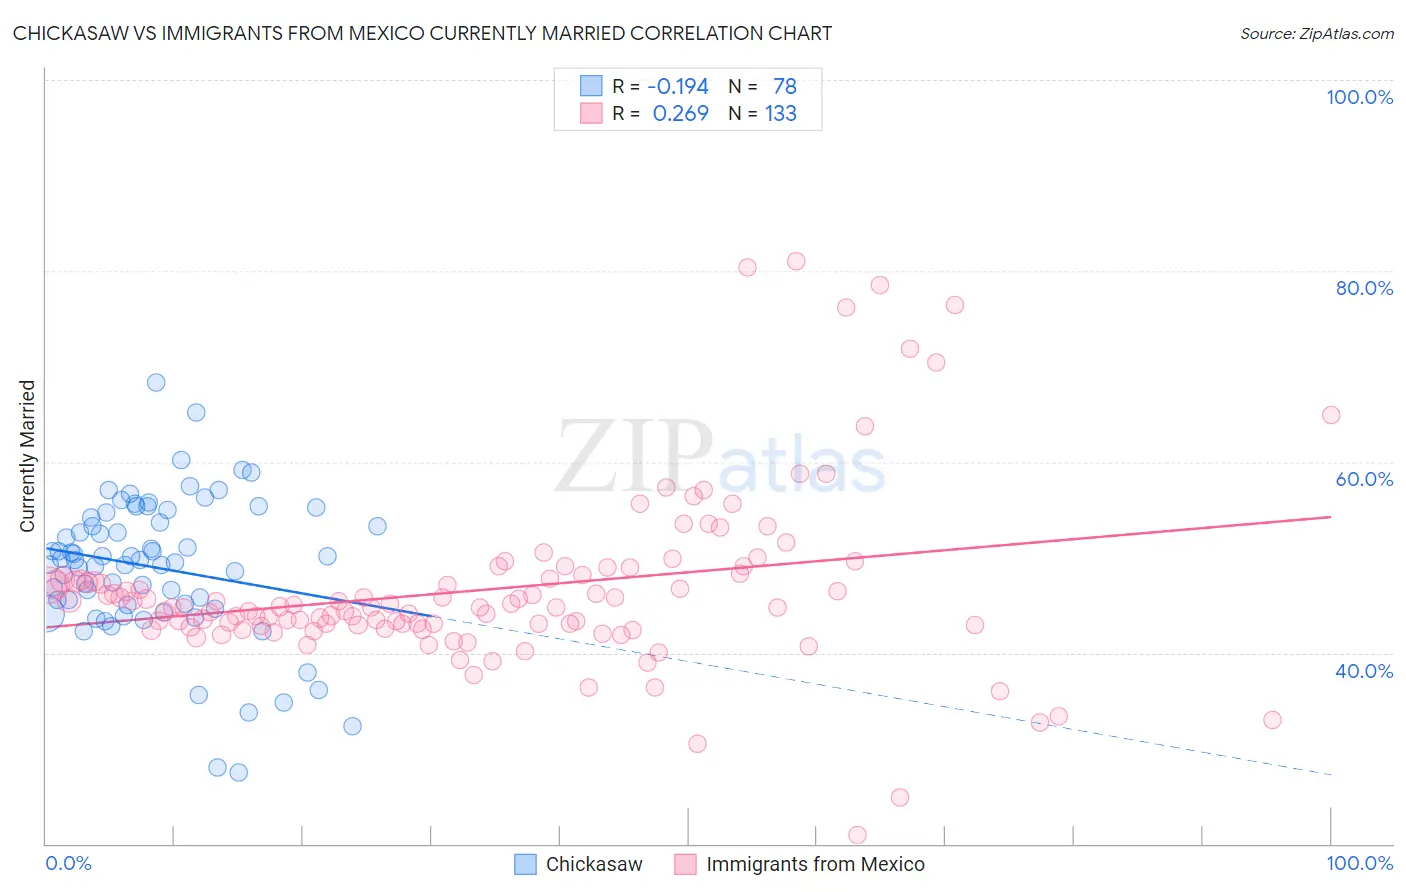
Chickasaw vs Immigrants from Mexico Currently Married Correlation Chart
The statistical analysis conducted on geographies consisting of 147,723,431 people shows a poor negative correlation between the proportion of Chickasaw and percentage of population currently married in the United States with a correlation coefficient (R) of -0.194 and weighted average of 46.6%. Similarly, the statistical analysis conducted on geographies consisting of 513,698,196 people shows a weak positive correlation between the proportion of Immigrants from Mexico and percentage of population currently married in the United States with a correlation coefficient (R) of 0.269 and weighted average of 44.5%, a difference of 4.6%.
Currently Married Correlation Summary
| Measurement | Chickasaw | Immigrants from Mexico |
| Minimum | 27.5% | 20.9% |
| Maximum | 68.4% | 81.0% |
| Range | 40.9% | 60.1% |
| Mean | 48.9% | 46.6% |
| Median | 49.7% | 44.8% |
| Interquartile 25% (IQ1) | 45.0% | 42.8% |
| Interquartile 75% (IQ3) | 54.2% | 47.9% |
| Interquartile Range (IQR) | 9.2% | 5.1% |
| Standard Deviation (Sample) | 7.5% | 9.3% |
| Standard Deviation (Population) | 7.4% | 9.2% |
Similar Demographics by Currently Married
Demographics Similar to Chickasaw by Currently Married
In terms of currently married, the demographic groups most similar to Chickasaw are Hawaiian (46.6%, a difference of 0.030%), Israeli (46.6%, a difference of 0.030%), Immigrants from Brazil (46.6%, a difference of 0.070%), Peruvian (46.6%, a difference of 0.080%), and Tlingit-Haida (46.7%, a difference of 0.12%).
| Demographics | Rating | Rank | Currently Married |
| Immigrants | Zimbabwe | 52.4 /100 | #171 | Average 46.7% |
| Aleuts | 52.0 /100 | #172 | Average 46.7% |
| Tlingit-Haida | 51.2 /100 | #173 | Average 46.7% |
| Peruvians | 50.0 /100 | #174 | Average 46.6% |
| Immigrants | Brazil | 49.9 /100 | #175 | Average 46.6% |
| Hawaiians | 48.6 /100 | #176 | Average 46.6% |
| Israelis | 48.6 /100 | #177 | Average 46.6% |
| Chickasaw | 47.8 /100 | #178 | Average 46.6% |
| Immigrants | Oceania | 44.6 /100 | #179 | Average 46.5% |
| Costa Ricans | 43.7 /100 | #180 | Average 46.5% |
| Ottawa | 43.0 /100 | #181 | Average 46.5% |
| Potawatomi | 41.9 /100 | #182 | Average 46.5% |
| Immigrants | Northern Africa | 39.7 /100 | #183 | Fair 46.5% |
| Brazilians | 39.3 /100 | #184 | Fair 46.4% |
| Mongolians | 37.6 /100 | #185 | Fair 46.4% |
Demographics Similar to Immigrants from Mexico by Currently Married
In terms of currently married, the demographic groups most similar to Immigrants from Mexico are Mexican American Indian (44.5%, a difference of 0.0%), Ethiopian (44.5%, a difference of 0.060%), Immigrants from Cambodia (44.5%, a difference of 0.090%), Immigrants from Ethiopia (44.5%, a difference of 0.10%), and Moroccan (44.6%, a difference of 0.14%).
| Demographics | Rating | Rank | Currently Married |
| Nepalese | 1.2 /100 | #232 | Tragic 44.7% |
| Immigrants | Saudi Arabia | 1.1 /100 | #233 | Tragic 44.7% |
| Iroquois | 1.1 /100 | #234 | Tragic 44.7% |
| Alaskan Athabascans | 0.9 /100 | #235 | Tragic 44.6% |
| Cubans | 0.9 /100 | #236 | Tragic 44.6% |
| Seminole | 0.9 /100 | #237 | Tragic 44.6% |
| Moroccans | 0.9 /100 | #238 | Tragic 44.6% |
| Immigrants | Mexico | 0.7 /100 | #239 | Tragic 44.5% |
| Mexican American Indians | 0.7 /100 | #240 | Tragic 44.5% |
| Ethiopians | 0.7 /100 | #241 | Tragic 44.5% |
| Immigrants | Cambodia | 0.7 /100 | #242 | Tragic 44.5% |
| Immigrants | Ethiopia | 0.7 /100 | #243 | Tragic 44.5% |
| Japanese | 0.6 /100 | #244 | Tragic 44.5% |
| Immigrants | Armenia | 0.4 /100 | #245 | Tragic 44.3% |
| Immigrants | Burma/Myanmar | 0.4 /100 | #246 | Tragic 44.3% |