Immigrants from Switzerland vs Central American Indian Currently Married
COMPARE
Immigrants from Switzerland
Central American Indian
Currently Married
Currently Married Comparison
Immigrants from Switzerland
Central American Indians
46.9%
CURRENTLY MARRIED
67.8/ 100
METRIC RATING
157th/ 347
METRIC RANK
43.3%
CURRENTLY MARRIED
0.0/ 100
METRIC RATING
279th/ 347
METRIC RANK
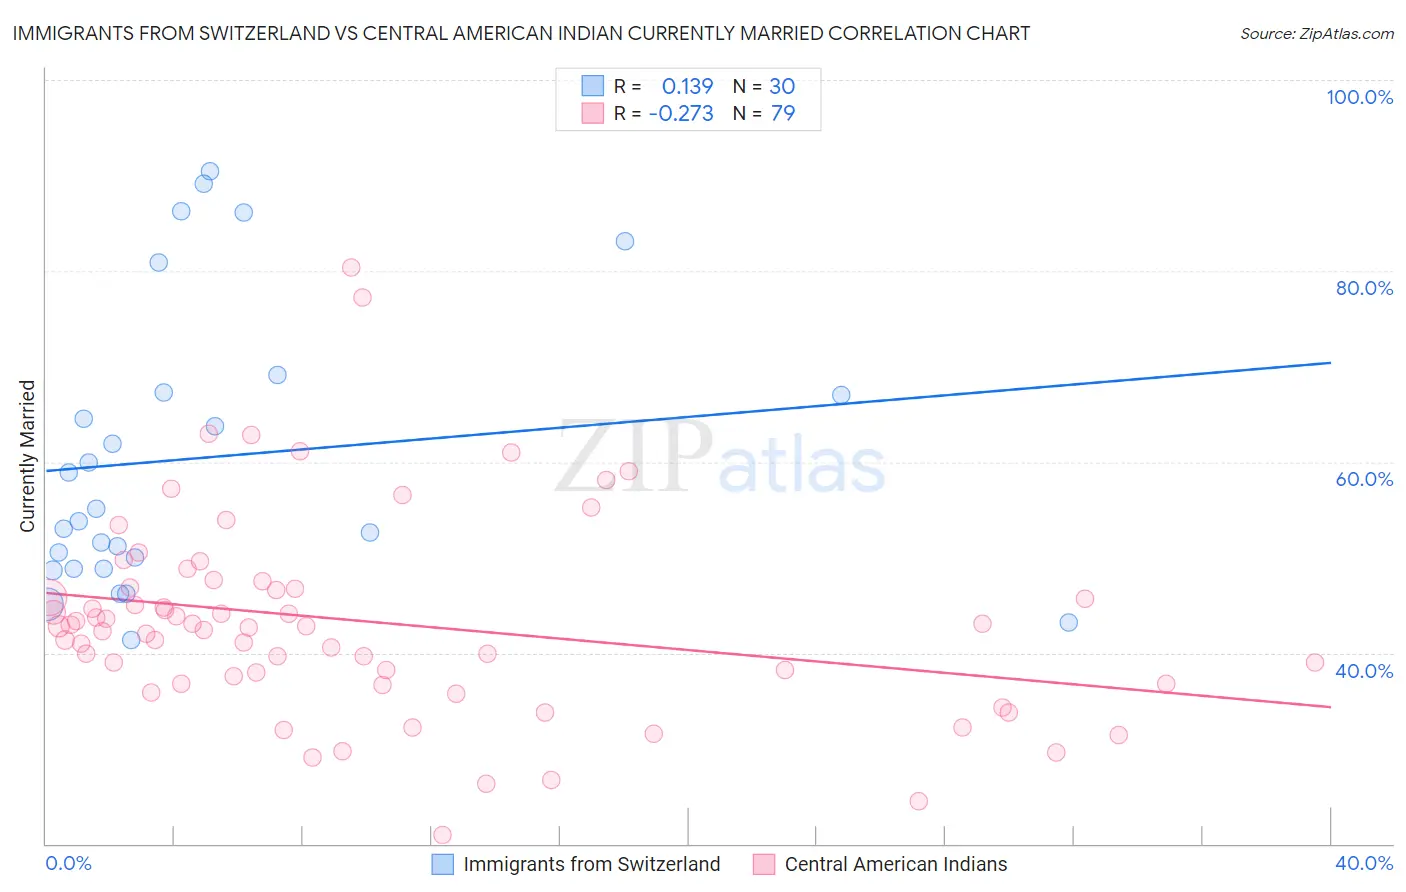
Immigrants from Switzerland vs Central American Indian Currently Married Correlation Chart
The statistical analysis conducted on geographies consisting of 148,074,779 people shows a poor positive correlation between the proportion of Immigrants from Switzerland and percentage of population currently married in the United States with a correlation coefficient (R) of 0.139 and weighted average of 46.9%. Similarly, the statistical analysis conducted on geographies consisting of 326,134,160 people shows a weak negative correlation between the proportion of Central American Indians and percentage of population currently married in the United States with a correlation coefficient (R) of -0.273 and weighted average of 43.3%, a difference of 8.5%.
Currently Married Correlation Summary
| Measurement | Immigrants from Switzerland | Central American Indian |
| Minimum | 41.3% | 20.9% |
| Maximum | 90.4% | 80.4% |
| Range | 49.1% | 59.5% |
| Mean | 60.5% | 43.3% |
| Median | 54.4% | 42.8% |
| Interquartile 25% (IQ1) | 48.8% | 36.8% |
| Interquartile 75% (IQ3) | 67.3% | 46.8% |
| Interquartile Range (IQR) | 18.5% | 10.0% |
| Standard Deviation (Sample) | 14.9% | 10.6% |
| Standard Deviation (Population) | 14.7% | 10.5% |
Similar Demographics by Currently Married
Demographics Similar to Immigrants from Switzerland by Currently Married
In terms of currently married, the demographic groups most similar to Immigrants from Switzerland are Spanish (47.0%, a difference of 0.010%), Immigrants from Venezuela (47.0%, a difference of 0.030%), Albanian (47.0%, a difference of 0.030%), Arab (47.0%, a difference of 0.030%), and Immigrants from Serbia (47.0%, a difference of 0.040%).
| Demographics | Rating | Rank | Currently Married |
| Immigrants | Turkey | 70.0 /100 | #150 | Good 47.0% |
| Chileans | 69.8 /100 | #151 | Good 47.0% |
| Immigrants | Serbia | 68.8 /100 | #152 | Good 47.0% |
| Immigrants | Venezuela | 68.6 /100 | #153 | Good 47.0% |
| Albanians | 68.6 /100 | #154 | Good 47.0% |
| Arabs | 68.6 /100 | #155 | Good 47.0% |
| Spanish | 68.1 /100 | #156 | Good 47.0% |
| Immigrants | Switzerland | 67.8 /100 | #157 | Good 46.9% |
| Cherokee | 66.8 /100 | #158 | Good 46.9% |
| Iraqis | 66.4 /100 | #159 | Good 46.9% |
| Immigrants | Uzbekistan | 66.0 /100 | #160 | Good 46.9% |
| Immigrants | Southern Europe | 65.9 /100 | #161 | Good 46.9% |
| Immigrants | Nonimmigrants | 65.4 /100 | #162 | Good 46.9% |
| Delaware | 64.7 /100 | #163 | Good 46.9% |
| Immigrants | Western Asia | 64.2 /100 | #164 | Good 46.9% |
Demographics Similar to Central American Indians by Currently Married
In terms of currently married, the demographic groups most similar to Central American Indians are Apache (43.2%, a difference of 0.080%), Chippewa (43.2%, a difference of 0.080%), Central American (43.3%, a difference of 0.15%), Immigrants from Ecuador (43.2%, a difference of 0.16%), and Kiowa (43.2%, a difference of 0.27%).
| Demographics | Rating | Rank | Currently Married |
| Indonesians | 0.1 /100 | #272 | Tragic 43.5% |
| Yaqui | 0.1 /100 | #273 | Tragic 43.4% |
| Nigerians | 0.1 /100 | #274 | Tragic 43.4% |
| Colville | 0.1 /100 | #275 | Tragic 43.4% |
| Sierra Leoneans | 0.1 /100 | #276 | Tragic 43.4% |
| Immigrants | Nigeria | 0.1 /100 | #277 | Tragic 43.4% |
| Central Americans | 0.0 /100 | #278 | Tragic 43.3% |
| Central American Indians | 0.0 /100 | #279 | Tragic 43.3% |
| Apache | 0.0 /100 | #280 | Tragic 43.2% |
| Chippewa | 0.0 /100 | #281 | Tragic 43.2% |
| Immigrants | Ecuador | 0.0 /100 | #282 | Tragic 43.2% |
| Kiowa | 0.0 /100 | #283 | Tragic 43.2% |
| Immigrants | El Salvador | 0.0 /100 | #284 | Tragic 43.1% |
| Immigrants | Middle Africa | 0.0 /100 | #285 | Tragic 43.0% |
| Ghanaians | 0.0 /100 | #286 | Tragic 42.9% |