Immigrants from Guatemala vs Central American Indian Currently Married
COMPARE
Immigrants from Guatemala
Central American Indian
Currently Married
Currently Married Comparison
Immigrants from Guatemala
Central American Indians
42.6%
CURRENTLY MARRIED
0.0/ 100
METRIC RATING
291st/ 347
METRIC RANK
43.3%
CURRENTLY MARRIED
0.0/ 100
METRIC RATING
279th/ 347
METRIC RANK
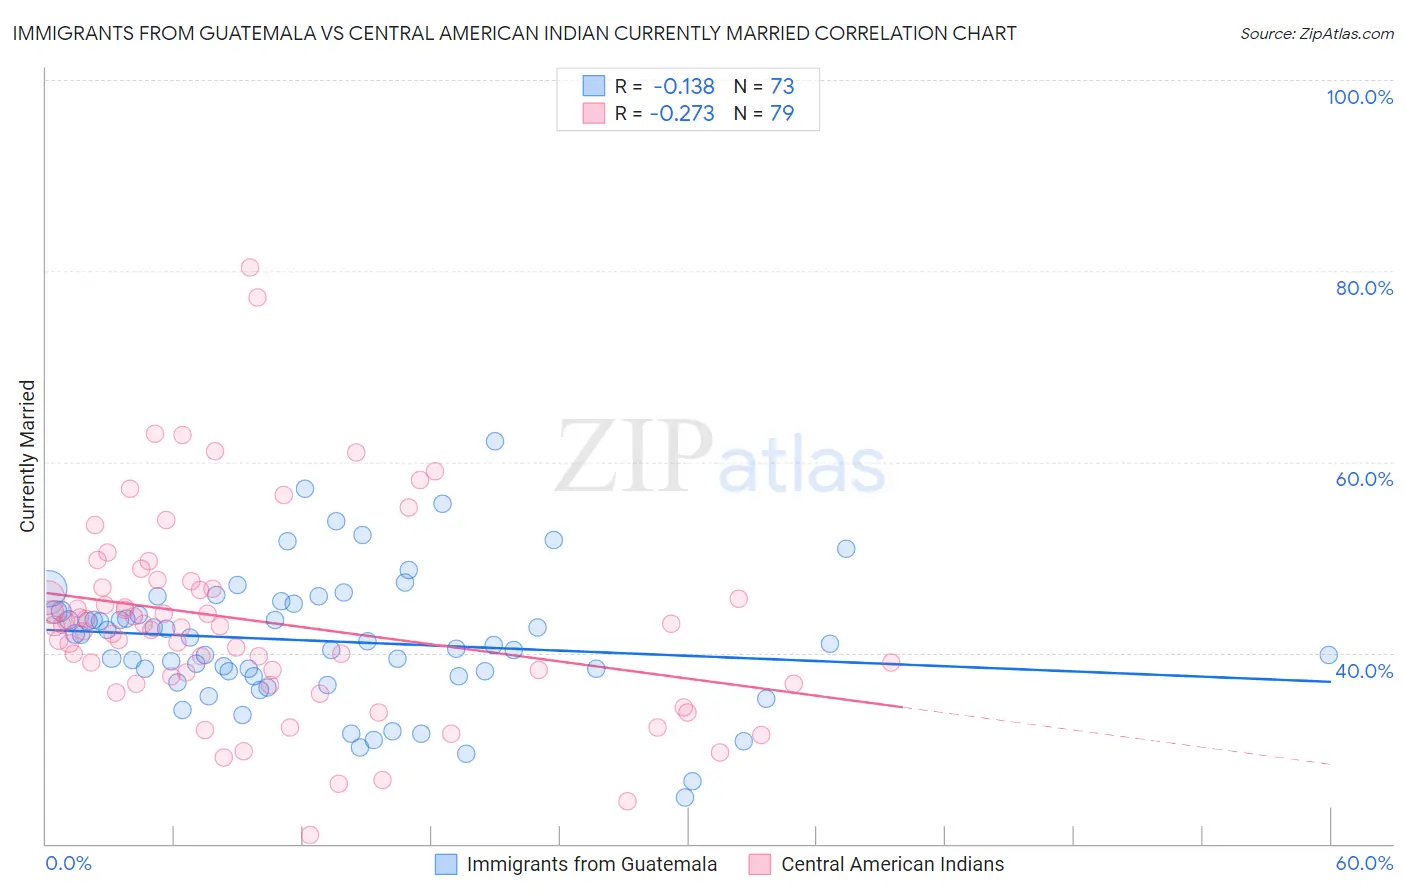
Immigrants from Guatemala vs Central American Indian Currently Married Correlation Chart
The statistical analysis conducted on geographies consisting of 377,254,434 people shows a poor negative correlation between the proportion of Immigrants from Guatemala and percentage of population currently married in the United States with a correlation coefficient (R) of -0.138 and weighted average of 42.6%. Similarly, the statistical analysis conducted on geographies consisting of 326,134,160 people shows a weak negative correlation between the proportion of Central American Indians and percentage of population currently married in the United States with a correlation coefficient (R) of -0.273 and weighted average of 43.3%, a difference of 1.5%.
Currently Married Correlation Summary
| Measurement | Immigrants from Guatemala | Central American Indian |
| Minimum | 24.9% | 20.9% |
| Maximum | 62.2% | 80.4% |
| Range | 37.3% | 59.5% |
| Mean | 41.2% | 43.3% |
| Median | 41.0% | 42.8% |
| Interquartile 25% (IQ1) | 37.6% | 36.8% |
| Interquartile 75% (IQ3) | 44.7% | 46.8% |
| Interquartile Range (IQR) | 7.1% | 10.0% |
| Standard Deviation (Sample) | 6.9% | 10.6% |
| Standard Deviation (Population) | 6.9% | 10.5% |
Demographics Similar to Immigrants from Guatemala and Central American Indians by Currently Married
In terms of currently married, the demographic groups most similar to Immigrants from Guatemala are Paiute (42.7%, a difference of 0.12%), Immigrants from Ghana (42.7%, a difference of 0.12%), Subsaharan African (42.6%, a difference of 0.16%), Yuman (42.6%, a difference of 0.18%), and Honduran (42.5%, a difference of 0.30%). Similarly, the demographic groups most similar to Central American Indians are Apache (43.2%, a difference of 0.080%), Chippewa (43.2%, a difference of 0.080%), Central American (43.3%, a difference of 0.15%), Immigrants from Ecuador (43.2%, a difference of 0.16%), and Kiowa (43.2%, a difference of 0.27%).
| Demographics | Rating | Rank | Currently Married |
| Colville | 0.1 /100 | #275 | Tragic 43.4% |
| Sierra Leoneans | 0.1 /100 | #276 | Tragic 43.4% |
| Immigrants | Nigeria | 0.1 /100 | #277 | Tragic 43.4% |
| Central Americans | 0.0 /100 | #278 | Tragic 43.3% |
| Central American Indians | 0.0 /100 | #279 | Tragic 43.3% |
| Apache | 0.0 /100 | #280 | Tragic 43.2% |
| Chippewa | 0.0 /100 | #281 | Tragic 43.2% |
| Immigrants | Ecuador | 0.0 /100 | #282 | Tragic 43.2% |
| Kiowa | 0.0 /100 | #283 | Tragic 43.2% |
| Immigrants | El Salvador | 0.0 /100 | #284 | Tragic 43.1% |
| Immigrants | Middle Africa | 0.0 /100 | #285 | Tragic 43.0% |
| Ghanaians | 0.0 /100 | #286 | Tragic 42.9% |
| Guatemalans | 0.0 /100 | #287 | Tragic 42.9% |
| Natives/Alaskans | 0.0 /100 | #288 | Tragic 42.8% |
| Paiute | 0.0 /100 | #289 | Tragic 42.7% |
| Immigrants | Ghana | 0.0 /100 | #290 | Tragic 42.7% |
| Immigrants | Guatemala | 0.0 /100 | #291 | Tragic 42.6% |
| Sub-Saharan Africans | 0.0 /100 | #292 | Tragic 42.6% |
| Yuman | 0.0 /100 | #293 | Tragic 42.6% |
| Hondurans | 0.0 /100 | #294 | Tragic 42.5% |
| Immigrants | Western Africa | 0.0 /100 | #295 | Tragic 42.4% |